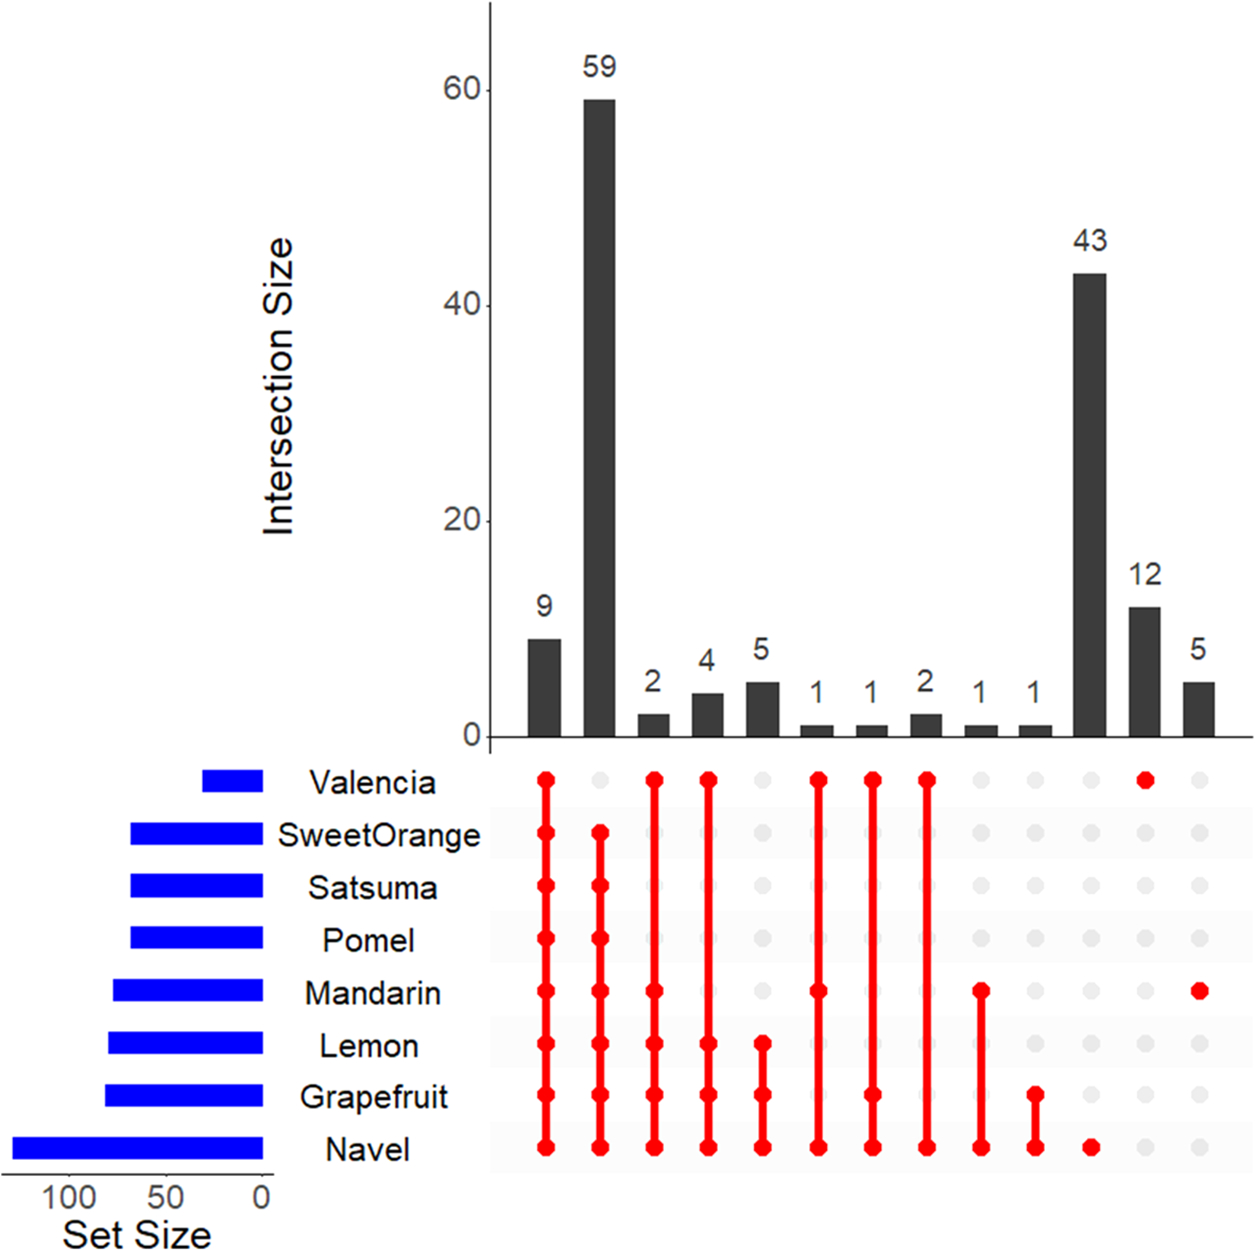
Figure 7.

Venn diagram of metabolite distribution among the citrus variety. The horizontal bars (blue) show the number of metabolites identified in each variety of the citrus listed, vertical red lines/circles show the number of overlapping metabolites across the different varieties, and the bar graph (black) shows the total counts in each. Nine metabolites overlap across all of the varieties (leftmost bar), while five metabolites are uniquely identified in mandarins.
