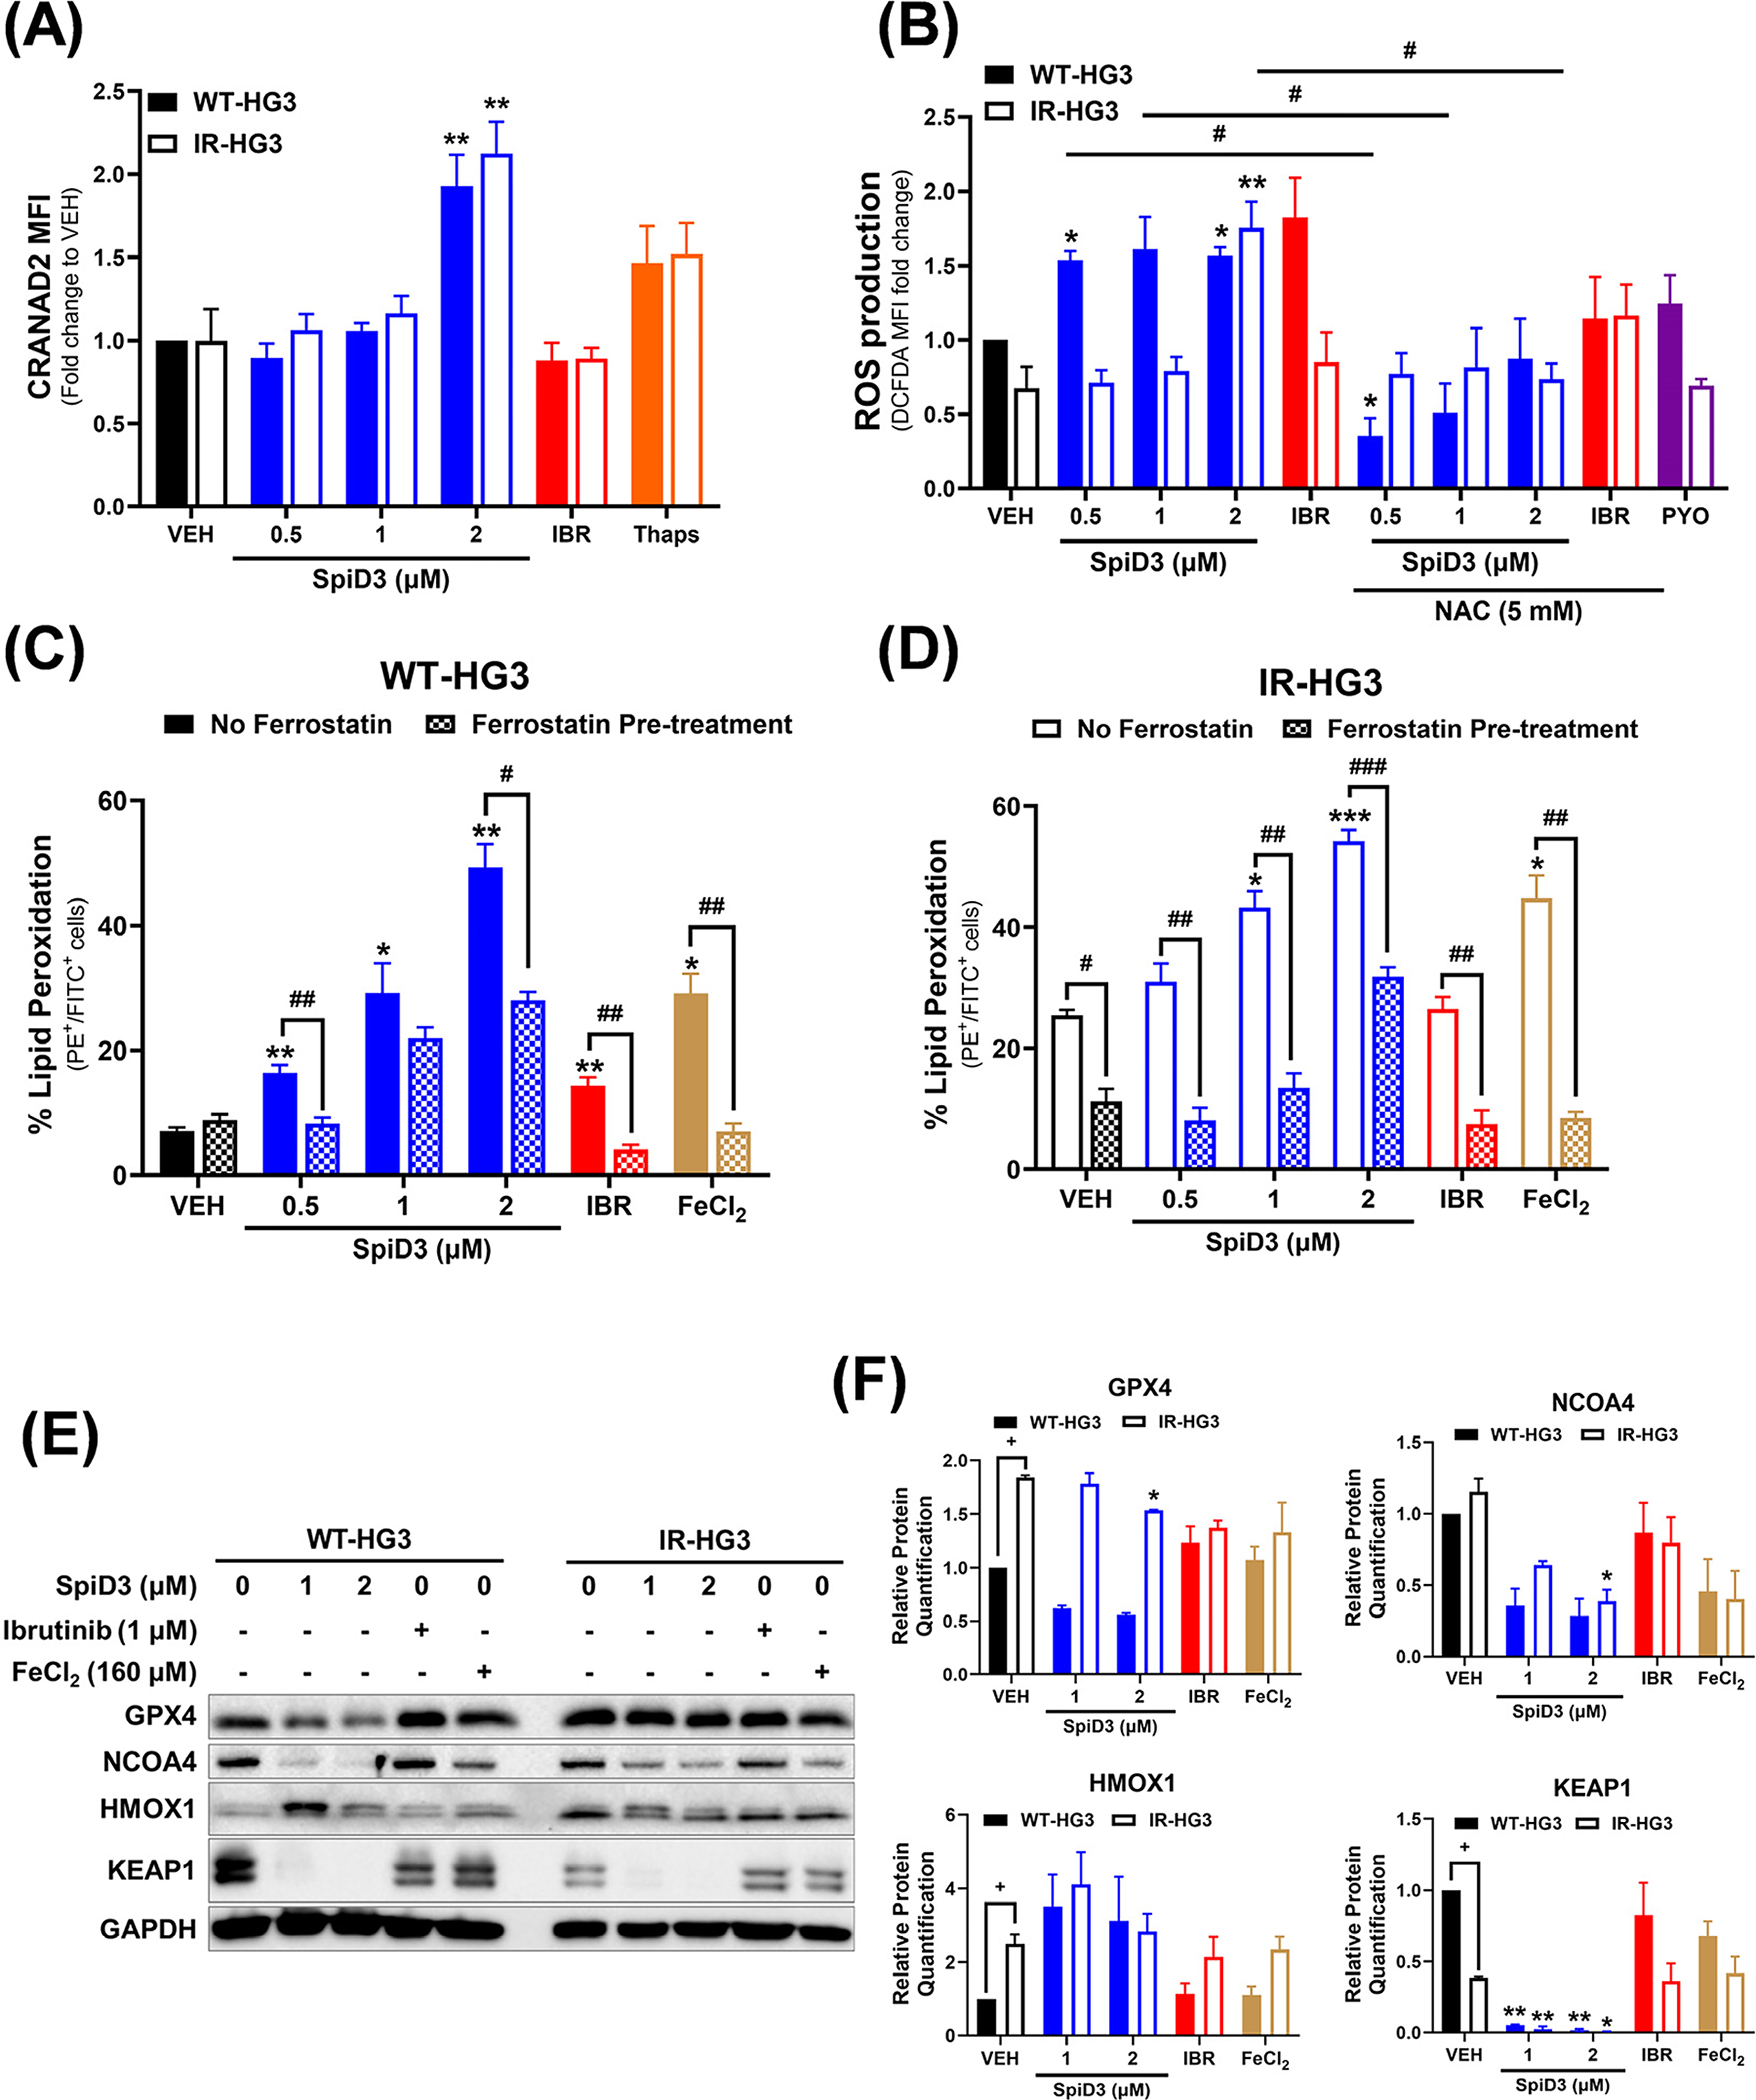
Figure 3. SpiD3 subverts oncogenic pathways in ibrutinib-resistant CLL cells.

(A) Parental wild-type (WT) and ibrutinib-resistant (IR) HG-3 cells were treated for 24 h with SpiD3 (0.5, 1, 2 μM), thapsigargin (Thaps; 2 μM), ibrutinib (IBR; 1 μM), or equivalent DMSO vehicle (VEH) and then incubated with CRANAD2 dye to probe for aggregate proteins. Data are represented as mean ± SEM of the fold-change in CRANAD2 median fluorescent intensity (MFI) compared to WT-HG3 VEH (n = 3 independent experiments/cell line). Asterisks denote significance vs. VEH: ** p < 0.01. (B) WT-HG3 and IR-HG3 cells were pre-treated with 5 mM N-acetylcysteine (NAC, 1 h), followed by SpiD3 (0.5, 1, 2 μM), IBR (1 μM), or VEH (24 h). Pyocyanin (PYO, 1 mM) served as a control ROS inducer (n = 3 independent experiments/cell line). ROS production is represented as the fold-change in DCFDA MFI to VEH-treated WT-HG3 cells. Data are represented as mean ± SEM. Asterisks denote significance vs. corresponding VEH: * p < 0.05, ** p < 0.01. Hashtags denote significance between non-NAC pre-treated samples vs. NAC pre-treated samples: # p < 0.05. (C,D): WT-HG3 (C) and IR-HG3 (D) cells were pre-treated with 10 μM ferrostatin (1 h; inhibitor of lipid peroxidation) followed by SpiD3 (0.5, 1, 2 μM), IBR (1 μM), or VEH (48 h). Iron (II) chloride tetrahydrate (FeCl2; 160 μM) served as a control lipid peroxidation inducer (n = 3 independent experiments/cell line). Cells were analyzed by flow cytometry for changes in peroxidized lipid generation, observed by a change in fluorescence from PE to FITC. Data are represented as mean ± SEM. Asterisks denote significance vs. corresponding VEH: * p < 0.05, ** p < 0.01, *** p < 0.001. Hashtags denote significance between non-ferrostatin pre-treated samples and ferrostatin pre-treated samples: # p < 0.05, ## p < 0.01, ### p < 0.001. (E) Representative immunoblot analysis of GPX4, NCOA4, KEAP1, and HMOX1 from WT- and IR-HG3 cells treated with SpiD3 (1, 2 μM), IBR (1 μM), FeCl2 (160 μM), or VEH for 4 h (n = 3 independent experiments/cell line). GAPDH served as the loading control. (F) Protein quantification of the immunoblot analysis of GPX4, NCOA4, KEAP1, and HMOX1. Data are represented as mean ± SEM. Asterisks denote significance vs. corresponding VEH: * p < 0.05, ** p < 0.01. Plus signs denote significance between WT-HG3 and IR-HG3 cells: + p < 0.05.
