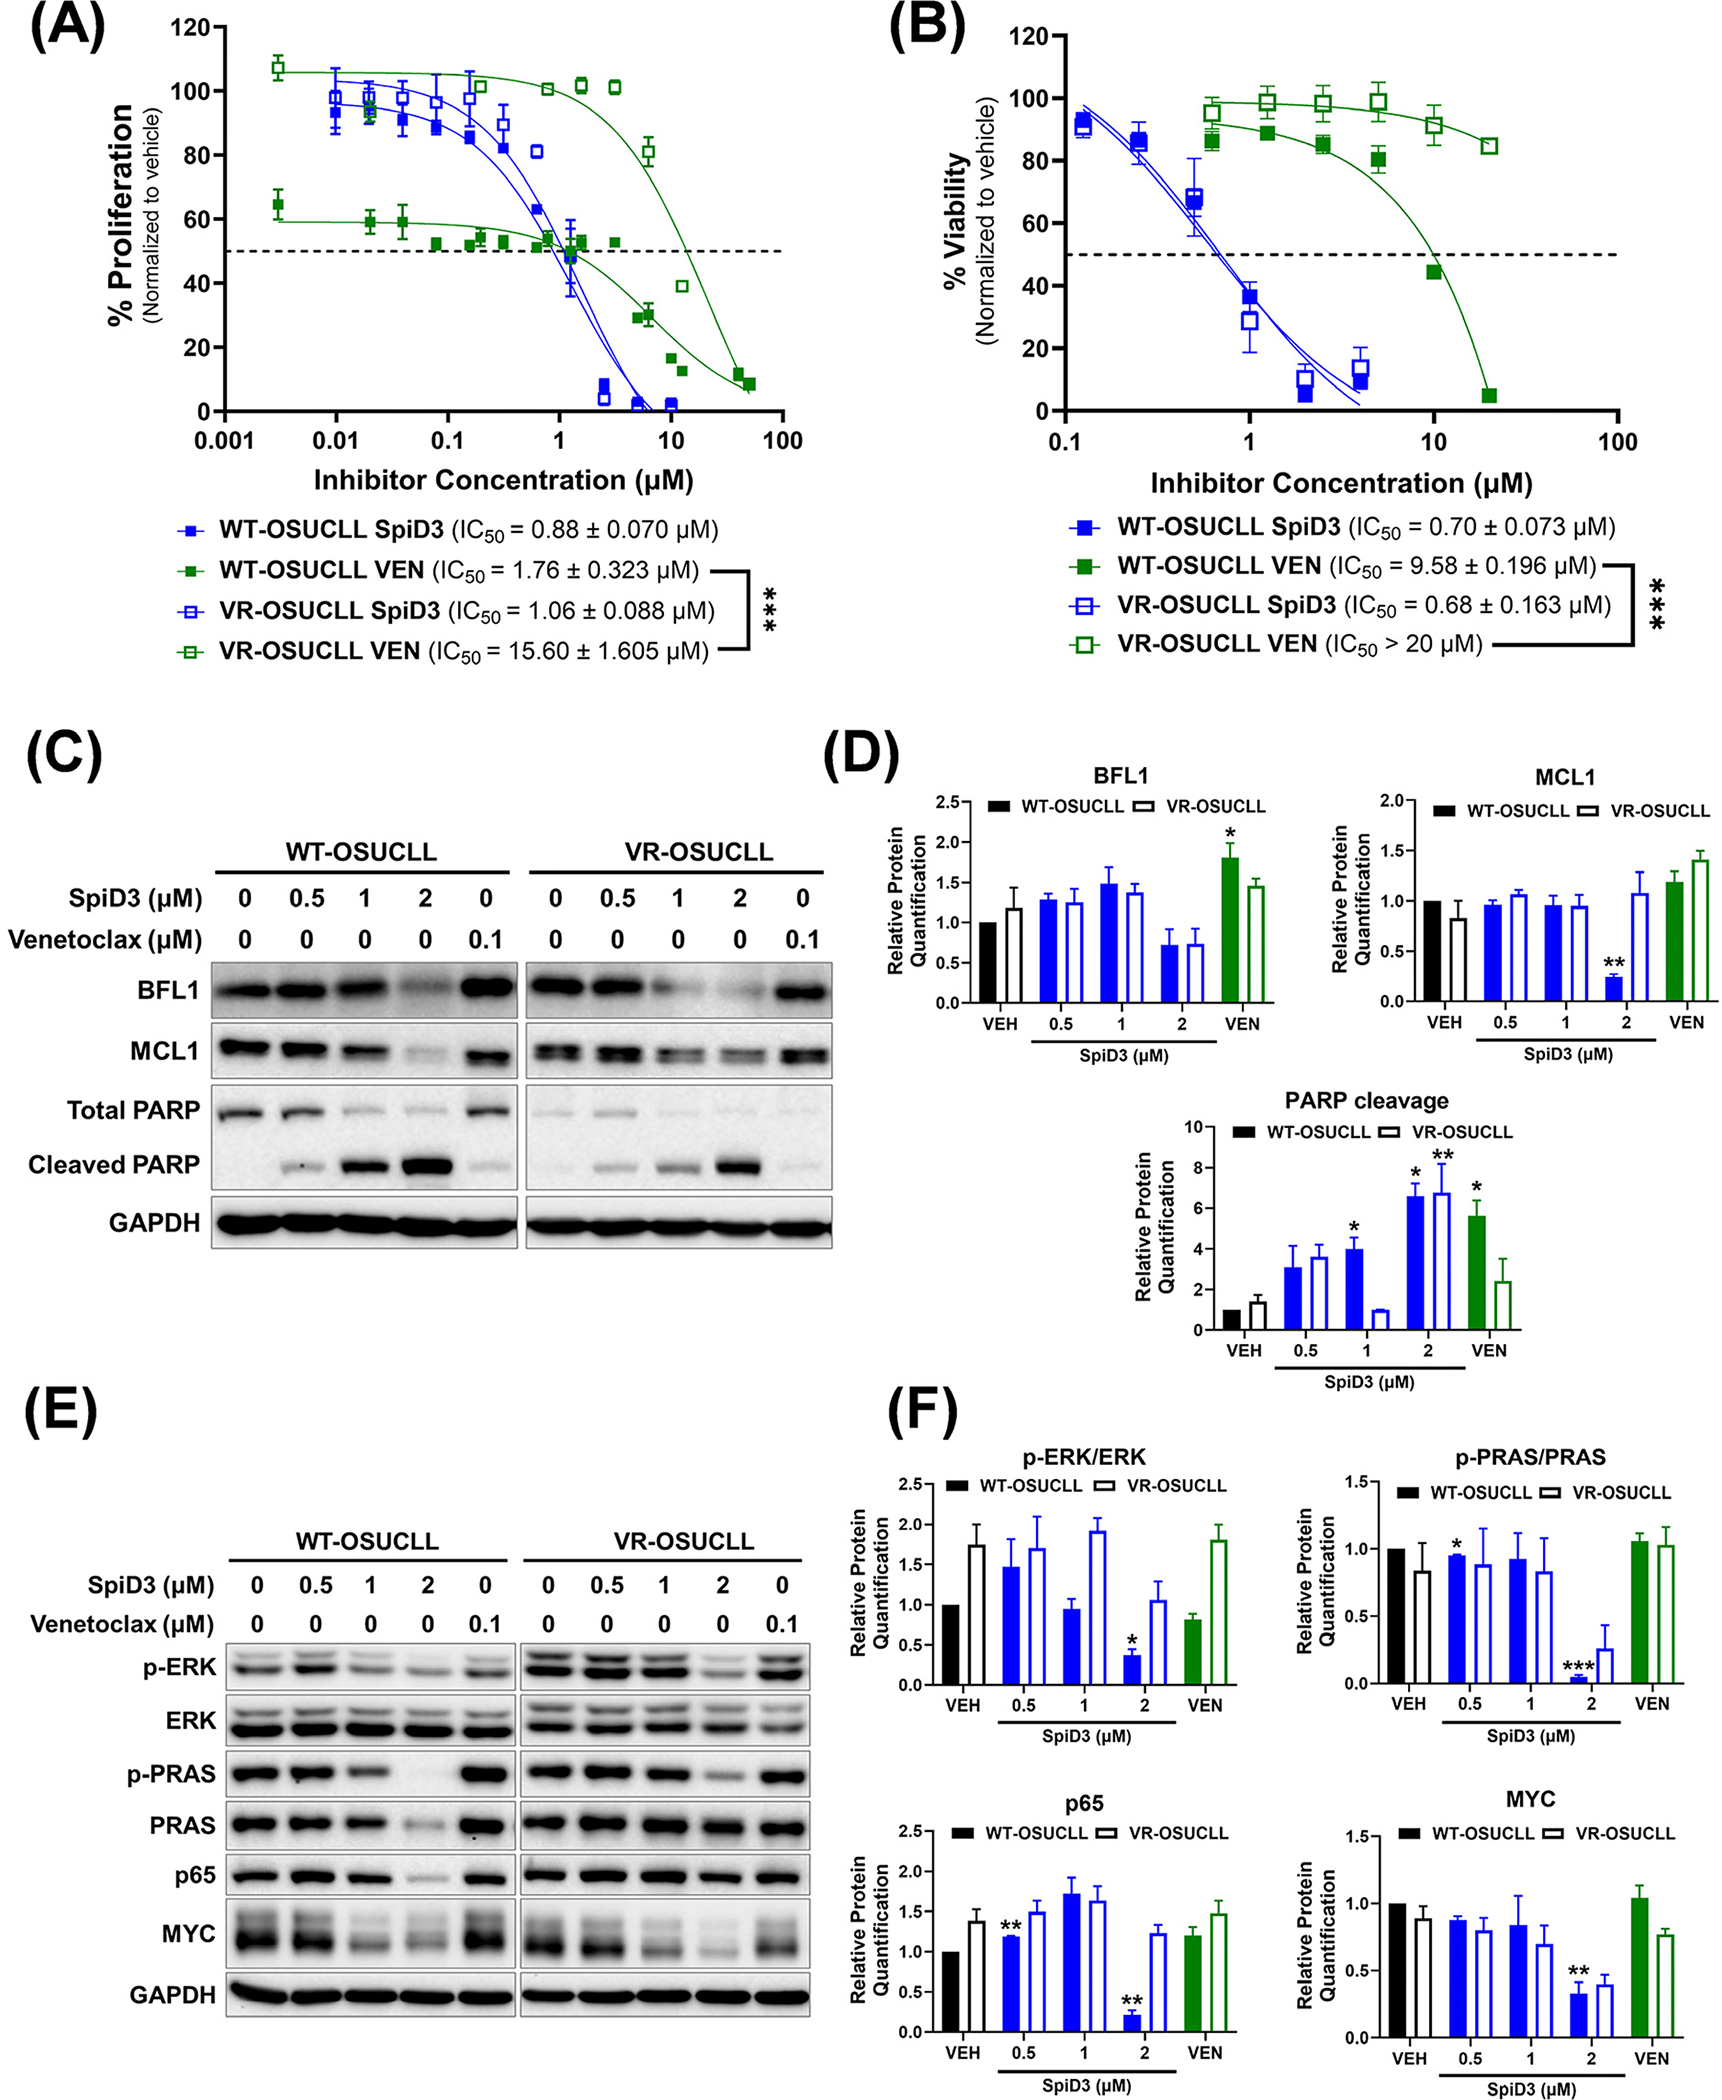
Figure 4. SpiD3 synergizes with venetoclax and elicits cytotoxic effects in venetoclax-resistant CLL cells.

(A) Parental wild-type (WT) and venetoclax-resistant (VR) OSU-CLL cell proliferation was assessed by MTS assay following treatment with increasing concentrations of SpiD3 or venetoclax (VEN; n = 3 independent experiments/cell line) for 72 h. IC50 values (mean ± SEM) are noted for each cell line. (B) Percent viability of WT- and VR-OSUCLL cell lines was determined by Annexin V-FITC/PI viability assay following 24 h treatment with SpiD3 (n = 3 independent experiments/cell line). Asterisks indicate significance vs. corresponding vehicle. *** p < 0.001. (C) Representative immunoblot analysis of BFL1, MCL1, and PARP (total and cleaved) from WT- and VR-OSUCLL cells treated with SpiD3 (0.5, 1, 2 μM), venetoclax (0.1 μM), or equivalent DMSO vehicle (VEH) for 24 h (n = 3 independent experiments/cell line). GAPDH was used as the loading control. (D) Protein quantification of the immunoblot analysis of BFL1, MCL1, and cleaved PARP. Data are represented as mean ± SEM. Asterisks denote significance vs. corresponding VEH: * p < 0.05, ** p < 0.01. (E) Representative immunoblot analysis of p-ERK (Thr202/Tyr204), total ERK, p-PRAS (Thr246), total PRAS, p65, and MYC from WT- and VR-OSUCLL cells treated with SpiD3 (0.5, 1, 2 μM), VEN (0.1 μM), or VEH for 24 h (n = 3 independent experiments/cell line). GAPDH was used as the loading control (run on a separate blot). (F) Protein quantification of the immunoblot analysis of p-ERK (Thr202/Tyr204), p-PRAS (Thr246), p65, and MYC. Data are represented as mean ± SEM. Asterisks denote significance vs. corresponding VEH: * p < 0.05, ** p < 0.01, *** p < 0.001.
