
Fig. 1.
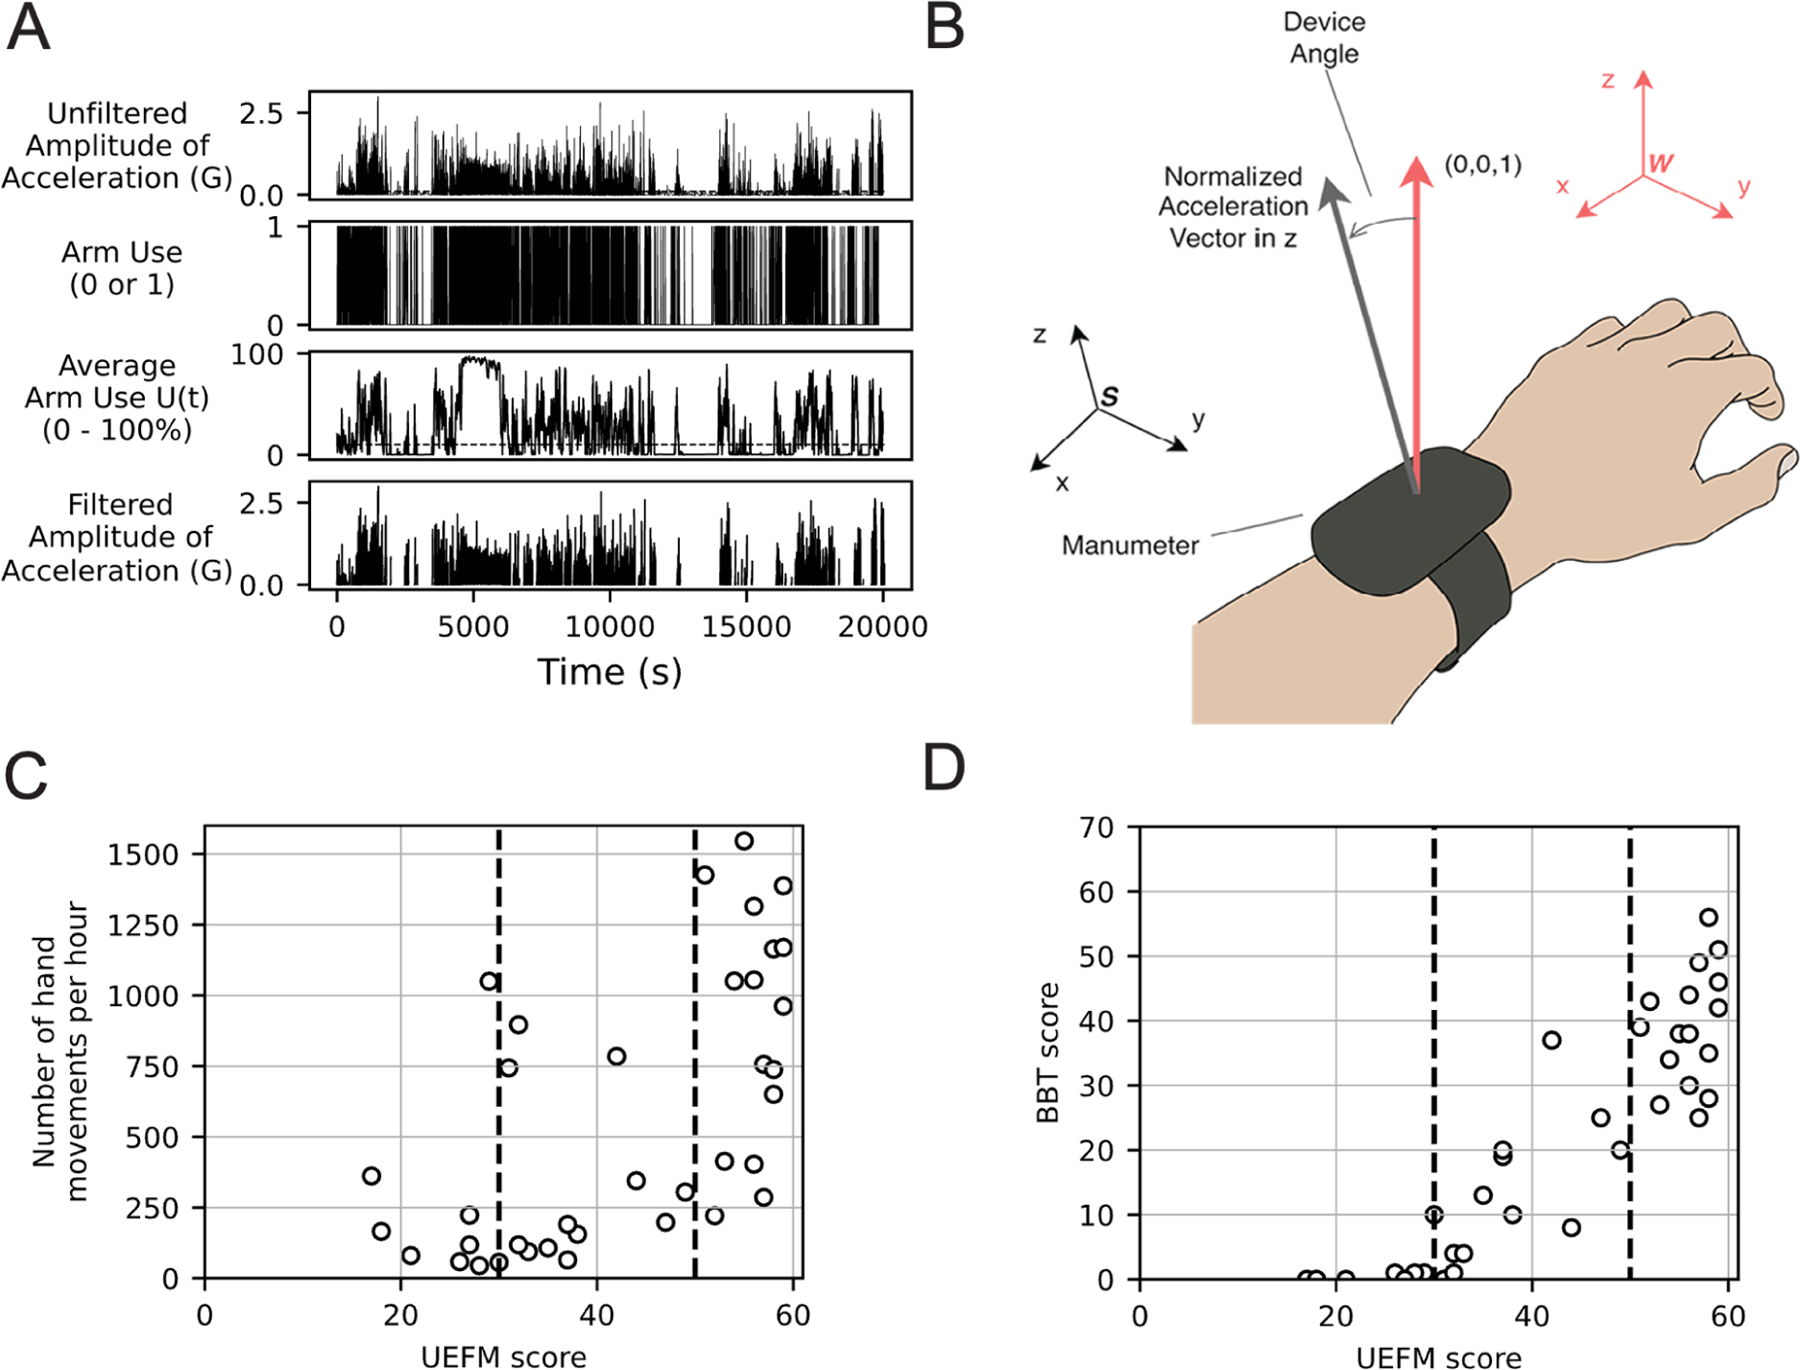
(A) Example of signals for one participant at different stages of preprocessing. From top to bottom: Raw amplitude of acceleration; Periods of active arm movement identified by the first threshold; Moving averages of filtered movements with a window size of 1000; Filtered acceleration using the second threshold. (B) The derivation of the device orientation with respect to acceleration vectors. The algorithm compares the tilt angle between a vector in the world coordinate frame W and a vector in the sensor coordinate frame S. (C) The relationship between BBT Score and UEFM Score, replotted from [46]. Hand function emerges around UEFM = 30 (first dashed line) (D) The relationship between hand use intensity and the UEFM score (replotted from [10]). The hand use intensity is the number of hand counts detected from the Manumeter. Daily hand use emerges around UEFM = 50.