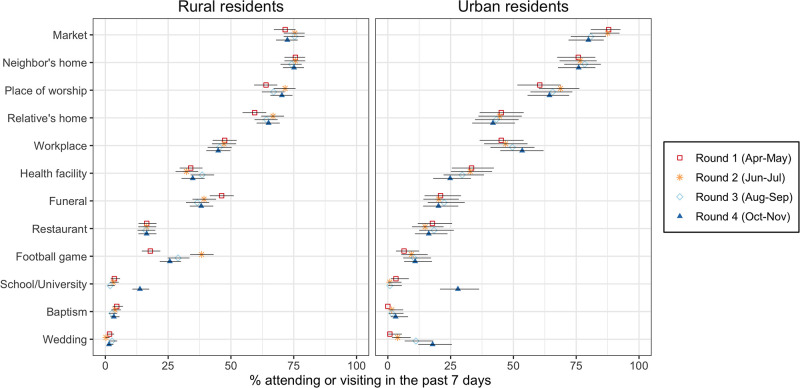
Fig 3. Attendance of places and events in Malawi (April to November 2020).
Notes: the data plotted in this graph were collected from a series of questions asking respondents whether they had attended the places listed on the y-axis in the past 7 days prior to the survey. The places that appear on the y-axis are ordered according to their attendance in urban areas in round 1. Error bars represent 95% confidence intervals. In calculating confidence intervals, standard errors were adjusted for the clustering of observations within respondents.

