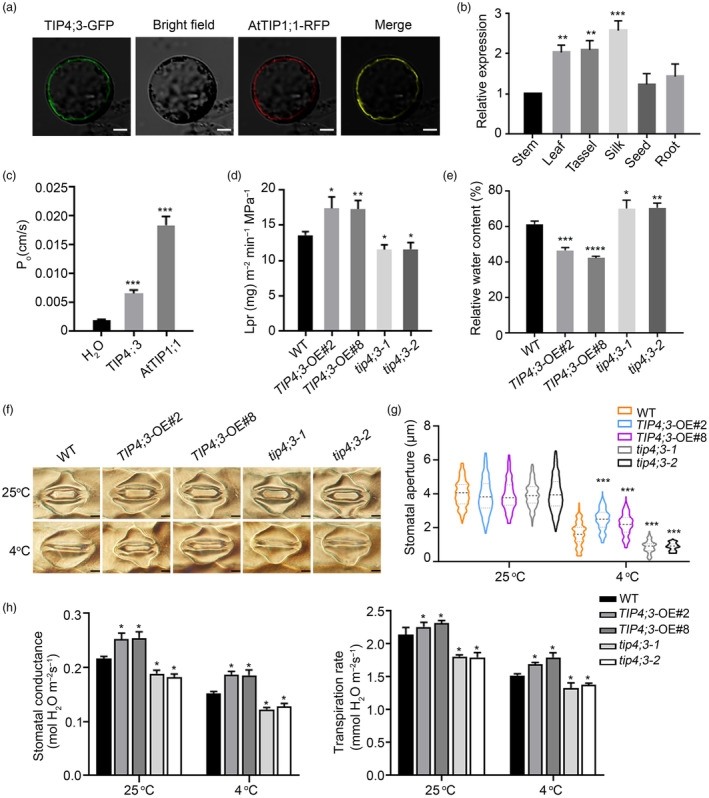
Figure 4.

Biochemical characterization of TIP4;3 in response to cold stress. (a) Subcellular localization of TIP4;3. AtTIP1;1‐RFP (a fusion between Arabidopsis TIP1;1 and red fluorescent protein) was used as a vacuolar marker. pSuper:TIP4;3‐GFP and pSuper:AtTIP1;1‐RFP were co‐transfected into maize mesophyll protoplasts. GFP and RFP signals were visualized by confocal microscopy. Scale bars, 10 μm. (b) The relative expression of TIP4;3 expression in different tissues of maize. (c) Osmotic water permeability (Po) of TIP4;3 in Xenopus oocytes. Water transport was assayed at 18 °C for 3 days after cRNA injection. Water transport activity analysis was performed as described in materials and methods. Oocytes injected with water were used as a negative control. AtTIP1;1, an aquaporin, was used as a positive control for water permeability. (d) Root hydraulic conductivity (Lpr) in WT, TIP4;3‐OE and tip4;3 plants. Culture in hydroponic conditions was conducted for this experiment. Four‐week‐old plants were used to measure root hydraulic conductivity. (e) Relative water content of WT, TIP4;3‐OE and tip4;3 plants after 4 °C treatment for 24 h. (f) Cold‐induced stomatal closure was photographed from the leaves of WT, TIP4;3‐OE and tip4;3 plants before and after (4 °C). Scale bars, 5 μm. (g) Stomatal aperture in WT, TIP4;3‐OE and tip4;3. Bars represent 200 stomata in five replicates under 25 °C and 4 °C conditions. Eight‐day‐old seedlings were immersed in MES‐KOH buffer, exposed to light at 25 °C for 5 h to completely open stomata, and then treated at 4 °C for 20 min before being photographed. The dashed horizontal line represents the median, and the upper and lower dotted lines represent the third quartile and first quartile respectively. The bounds of the plot represent data density. ***P < 0.001, **P < 0.01, *P < 0.05 two‐sided t‐test. (h) Analysis of stomatal conductance and transpiration rate under permissive temperature and after cold treatment for 24 h. In b, c, d, e, g, h, bars represent mean ± SD (standard deviation) from three independent experiments. ****P < 0.0001, ***P < 0.001, **P < 0.01, *P < 0.05 (two‐sided t‐test).
