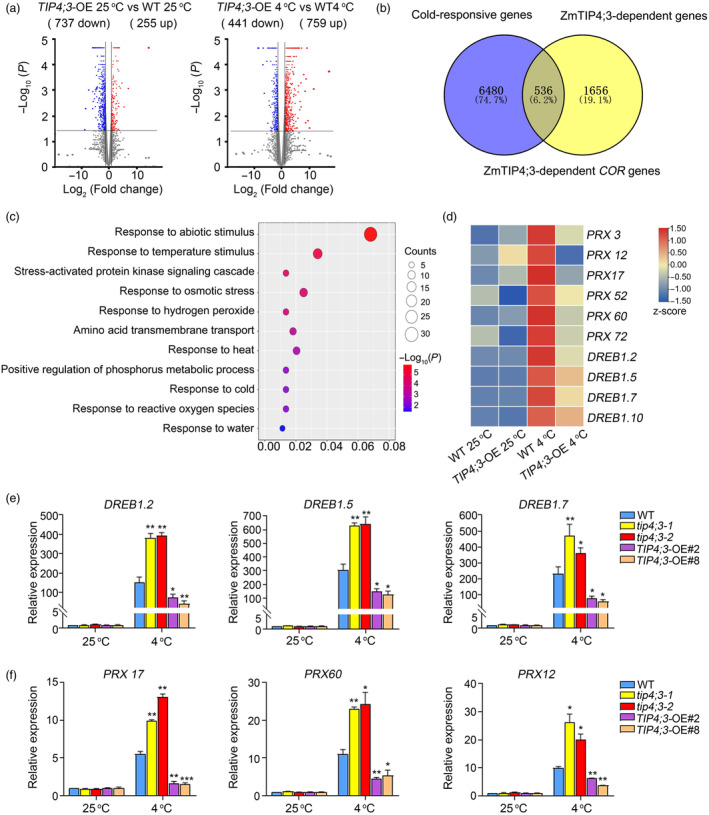
Figure 5.

Transcriptome analysis of TIP4;3‐dependent genes. (a) Volcano plots showing the number of differentially expressed genes (DEGs) between WT and TIP4;3‐OE plants under control conditions (25 °C) or following cold treatment (25 °C). DEGs were identified using a P‐value <0.05 and absolute log2 (fold‐change) value ≥1 as criteria. (b) Venn diagram showing the extent of overlap between TIP4;3‐dependent genes and COLD‐REGULATED (COR) genes. (c) Gene ontology term enrichment analysis of TIP4;3‐dependent COR genes. (d) Heatmap representation of expression levels for some DEGs modulated by TIP4;3. FPKM values were Z‐score normalized. (e, f) Relative expression levels of DREB1.2, DREB1.5, DREB1.7, PRX12, PRX17 and PRX60 in WT, TIP4;3‐OE lines and tip4;3 mutants under cold stress. Error bars represent mean ± SD (standard deviation) (n = 3; two‐sided t‐test). **P < 0.01, *P < 0.05.
