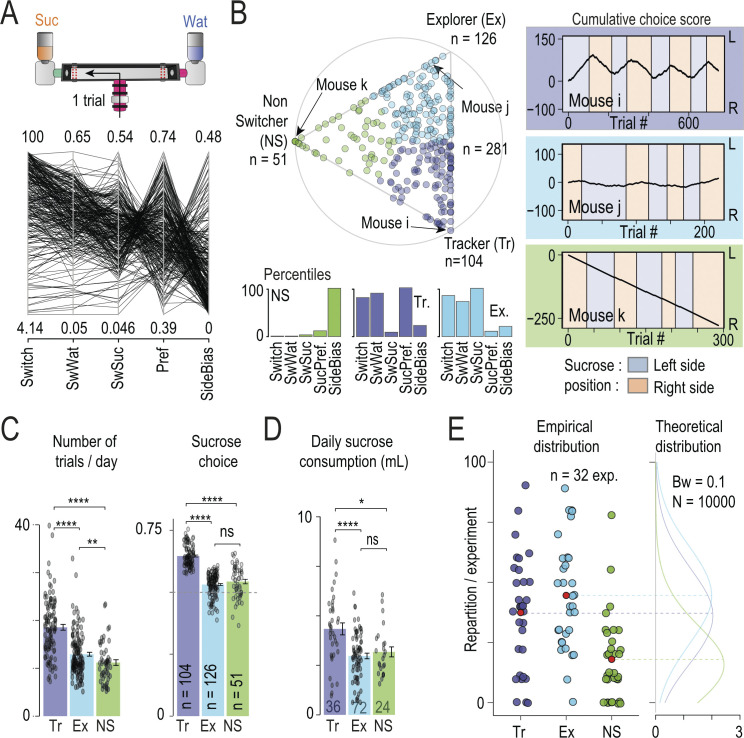
Fig 2. Mice exhibit interindividual differences in choice strategies in the T-maze.
(A) Top: one trial is considered to be one choice between left or right side in the T-maze. Bottom: Value of the 5 parameters that describe mice sequence of choice in the T-maze during SW sessions (n = 281 mice): the level of global switching (Switch), the probability of switching sides if the previous choice was water (SwWat) or sucrose (SwSuc), the preference (Pref) and side bias (SideBias) on each session. Top and bottom value correspond to the min (bottom) and max (top) value for each parameter. (B) Archetypal analysis of the choice strategies based on the 5-dimensional data space. Top: Visualization of the α coefficients using a ternary plot. Each point represents the projection of an individual (n = 281 mice) onto the plane defined by a triangle where the 3 apices represent the 3 archetypes: Tracker (Tr, purple), Explorer (Ex, blue), and non-Switcher (NS, green). Points are color-coded according to their proximity to the archetypes. Bottom: Histograms showing the 3 archetypes’ percentiles for each choice parameter. Right: Examples of 3 sequences of choice made by 3 mice close to the archetype. Sucrose position alternates across sessions between the left (light purple) and the right (light orange) side. Cumulated choices across trials are calculated with a positive (+1) or negative (−1) increment when the left or right side is chosen, respectively. The mouse i, j, k (from top to bottom corresponds respectively to a Tr, Exp and NS profile (see their projection in the ternary plot)). (C) Number of trials per days (left) and percentage of sucrose side choice (right) for the 3 archetypes (pairwise Wilcoxon tests with Holm correction). (D) Daily sucrose consumption for the 3 archetypes (pairwise Wilcoxon tests with Holm correction). (E) Repartition of archetypes per experiment showed that they are not evenly represented in each group (N = 32, red dot indicated mean values, left) and built theoretical densities expected for each archetype based on a random draw from mean groups sizes (Bandwidth = 0.1, n = 10,000, right). Data can be found here https://zenodo.org/uploads/13374058.

