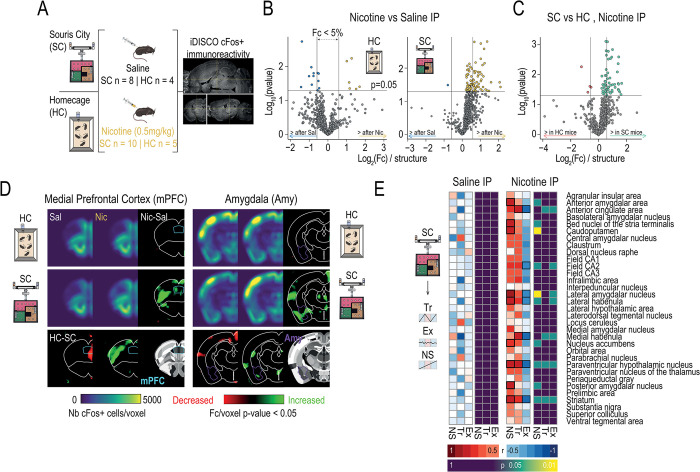
Fig 6. Differential response to nicotine as a function of the environment and decision-making strategy.
(A) Brain-wide cFos expression mapping after saline or nicotine injection in mice living in standard home cages (HC) or Souris-City (SC) revealed by iDISCO brain clearing and Clearmap. (B) Mice in HC conditions do not show significant differences in cellular activity between saline and nicotine injections, while mice in SC show a shift toward increased cFos expression (greater fold change of the number of cFos+ cells per region) following a nicotine injection when compared to a saline one. (C) Comparison between nicotine-induced cFos expression in SC and HC mice reveals that SC mice show greater numbers of cFos-positive cells per region in response to nicotine than mice raised under standard conditions. (D) Grouped heatmaps show average density of cFos-positive cells in the PFC (left) and the amygdala (right). P-value maps highlight areas where significant between-groups differences can be appreciated. (E) Correlations between cFos expression and distance to the archetype in saline and nicotine-injected SC animals. Left: minimal differences in cFos expression are observed between mouse profiles in SC in response to a saline injection. Right: patterns of expression across brain regions associated with cognitive and reward functions that become apparent after challenging the different mouse profiles with nicotine.

