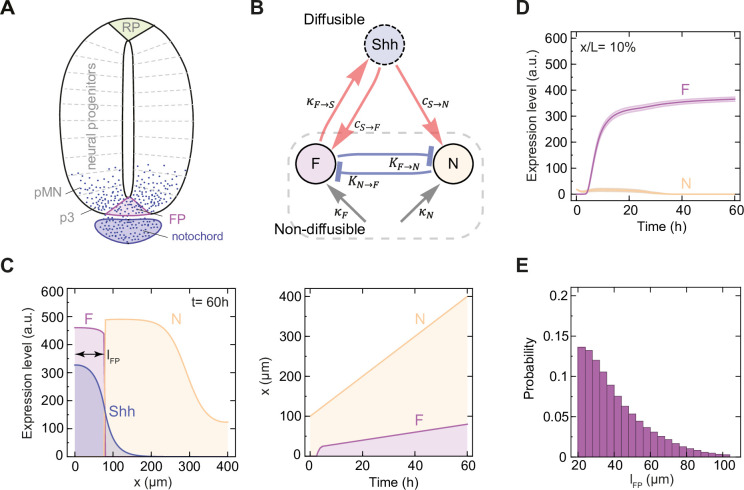
Fig 1. Model of floor plate formation in a growing tissue.
A. Schematic illustration of the neural tube with indicated notochord, floor plate (FP), neural progenitor domains including p3 and pMN (grey), and roof plate (RP). Shh is depicted with blue dots. B. Schematic of the interactions in the model of FP formation considered in this study (Eq 1). The nodes correspond to the non-diffusible transcription factors F and N, which define floor plate (F; purple) and neural progenitor identities (N; yellow), and to diffusible Shh morphogen (blue). Edges indicate interactions: activation (red), repression (blue), and uniform activation (grey). Parameters representing interaction strengths are given next to each edge. C. Spatial pattern of FP (light purple), neural progenitor domains (yellow) and Shh (dark purple) at the end of the simulation (left) and over time as the tissue grows (right). lFP (double-arrow) indicates the FP size at t = 60 h. D. Mean temporal profile of F and N expression level at x/L = 10% for n = 214 randomly selected successful solutions. Shaded regions are SEM. Colors as in C. E. Probability distribution of lFP in successful solutions of the computational screen, n = 169 979.

