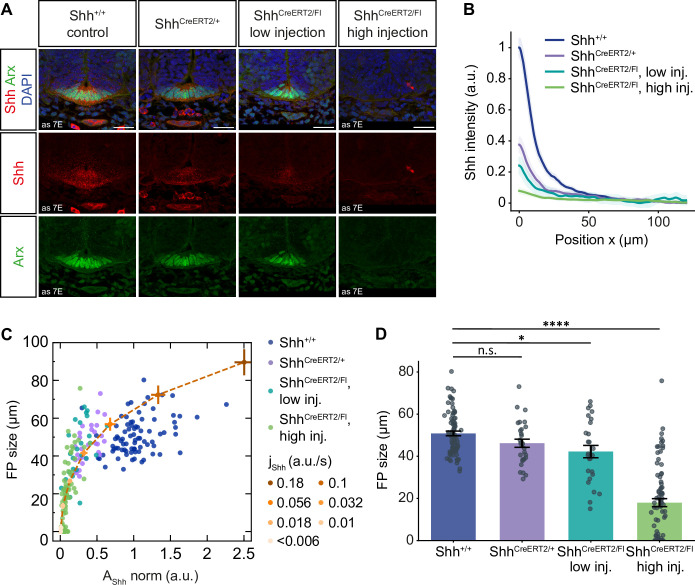
Fig 8. FP size depends non-linearly on changes in Shh production.
A. Representative mouse brachial sections at E10.5 from control, ShhCreERT2/+ heterozygous knock-ins, ShhCreERT2/Fl injected with 2mg tamoxifen at E6.5 (low injection), and ShhCreERT2/Fl injected with 3mg tamoxifen at E5.5 and E6.5 (high injection). The data for the control and high injection conditions are the same as in Fig 7E and are repeated here to facilitate comparison. Immunostaining as indicated. Scale bar = 30 μm. B. Mean Shh FI profiles in the receiving tissue with 95% CI (shaded) for the conditions shown in A, normalized to the maximum FI in the control condition. Number of sections: n = 83 (control), n = 29 (ShhCreERT2/+), n = 26 (low injection), n = 81 (high injection). C. FP size and Shh amplitude measured from individual sections at E10.5 for the indicated conditions with different levels of Shh production. Orange line and points show simulation data at t = 60 h for insensitive solutions resulting in large FPs (lFP/Lend = 20%) for different values of jShh as indicated, and αS, where αS was varied in proportion to jShh. αS = 0.1 h-1 (default) for jShh = 0.1 a. u./s. Error bars, SEM. D. Quantification of the Arx-positive area in the experiment in A. Error bars, SEM. One-way ANOVA test: * 0.05 ≥ P > 0.01; **** P ≤ 0.0001.

