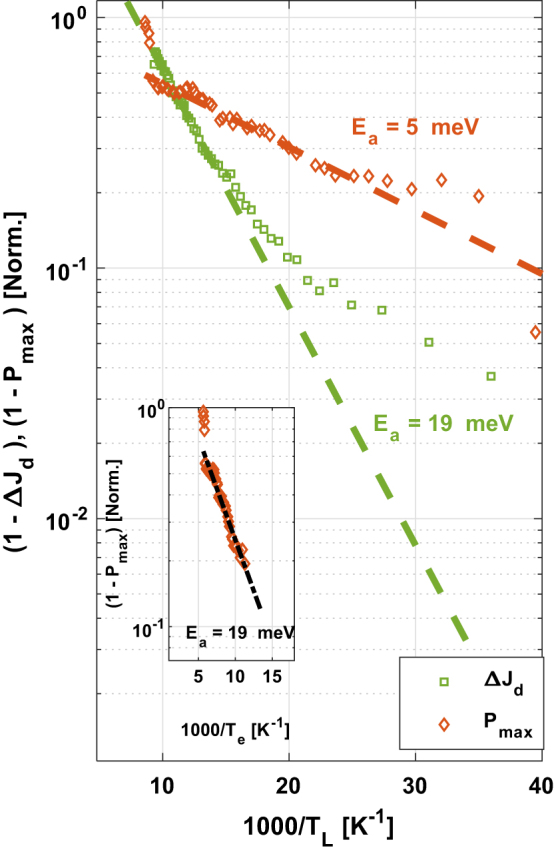
Figure 4:

Activation energy extracted from the current dynamic range ΔJ d = (J max − J th) (green squares) and the laser’s maximum power output (P max) (brown diamonds). The quantities in the y-axis are and respectively presented in logarithmic scale. An Arrhenius plot for is presented in the inset, this time as a function of the electron temperature T e, including a characteristic excess temperature of ∼60 K, resulting in an activation barrier of ∼19 meV for the laser’s maximum power output (P max) (brown diamonds) data, similarly to the current dynamic range ΔJ d = (J max − J th) (green squares in main Figure) data with zero excess electron temperature.
