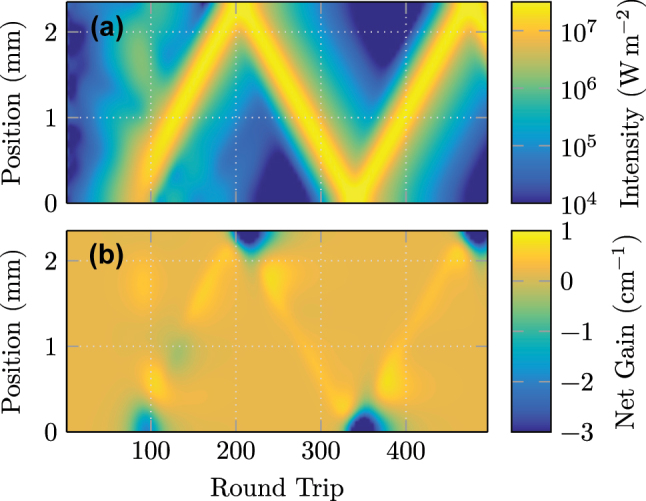
Figure 4:

Visualization of (a) intracavity intensity and (b) net gain during the formation process. The zigzag trace arises from a slight intentional undersampling of the round trip frequency, such that the pulse is visualized at each point of the cavity.
