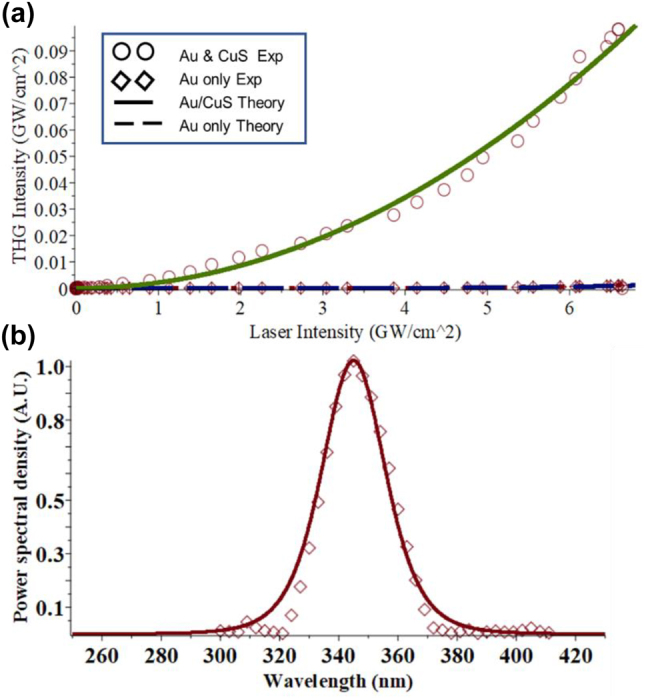
Figure 4:

Correlation between experimental results and predicted values from dipole–dipole analytic model. (a) THG signal as a function of input intensity from predicted from analytic model for: 15 nm diameter Au and CuS nanoparticle hybrid film (solid green) and Au nanoparticle only (dashed purple). Experimental data (Figure 2b) from bilayer films are plotted as circles and data from single species films with diamonds. (b) The predicted output intensity of upconverted light at various wavelengths, diamonds are experimental data from Figure 1b. Line theoretical fit centered on 3ω with a fitting full width at half max of 25 nm.
