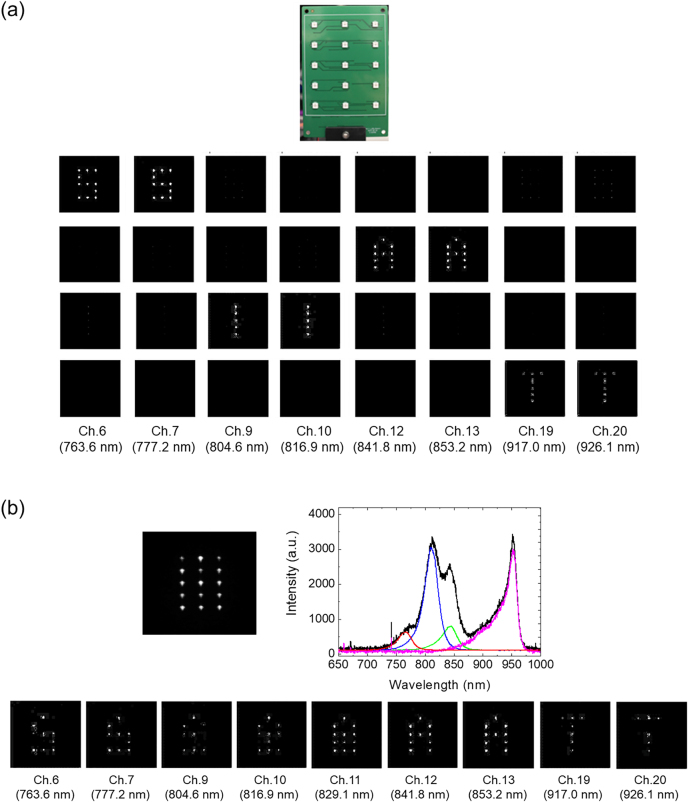
Figure 4:
Hyperspectral imaging of the meta-spectral imager.
(a) (Top) Photograph of the test panel for spectral imaging. (Bottom) Spectral images measured when only one letter is switched on. Letter is the brightest at the peak wavelength of LED emission. (b) (Top-left) Image of combined letters. (Top-right) Reference spectra of the LED emissions. (Bottom) Spectral images divided into 20 channels.

