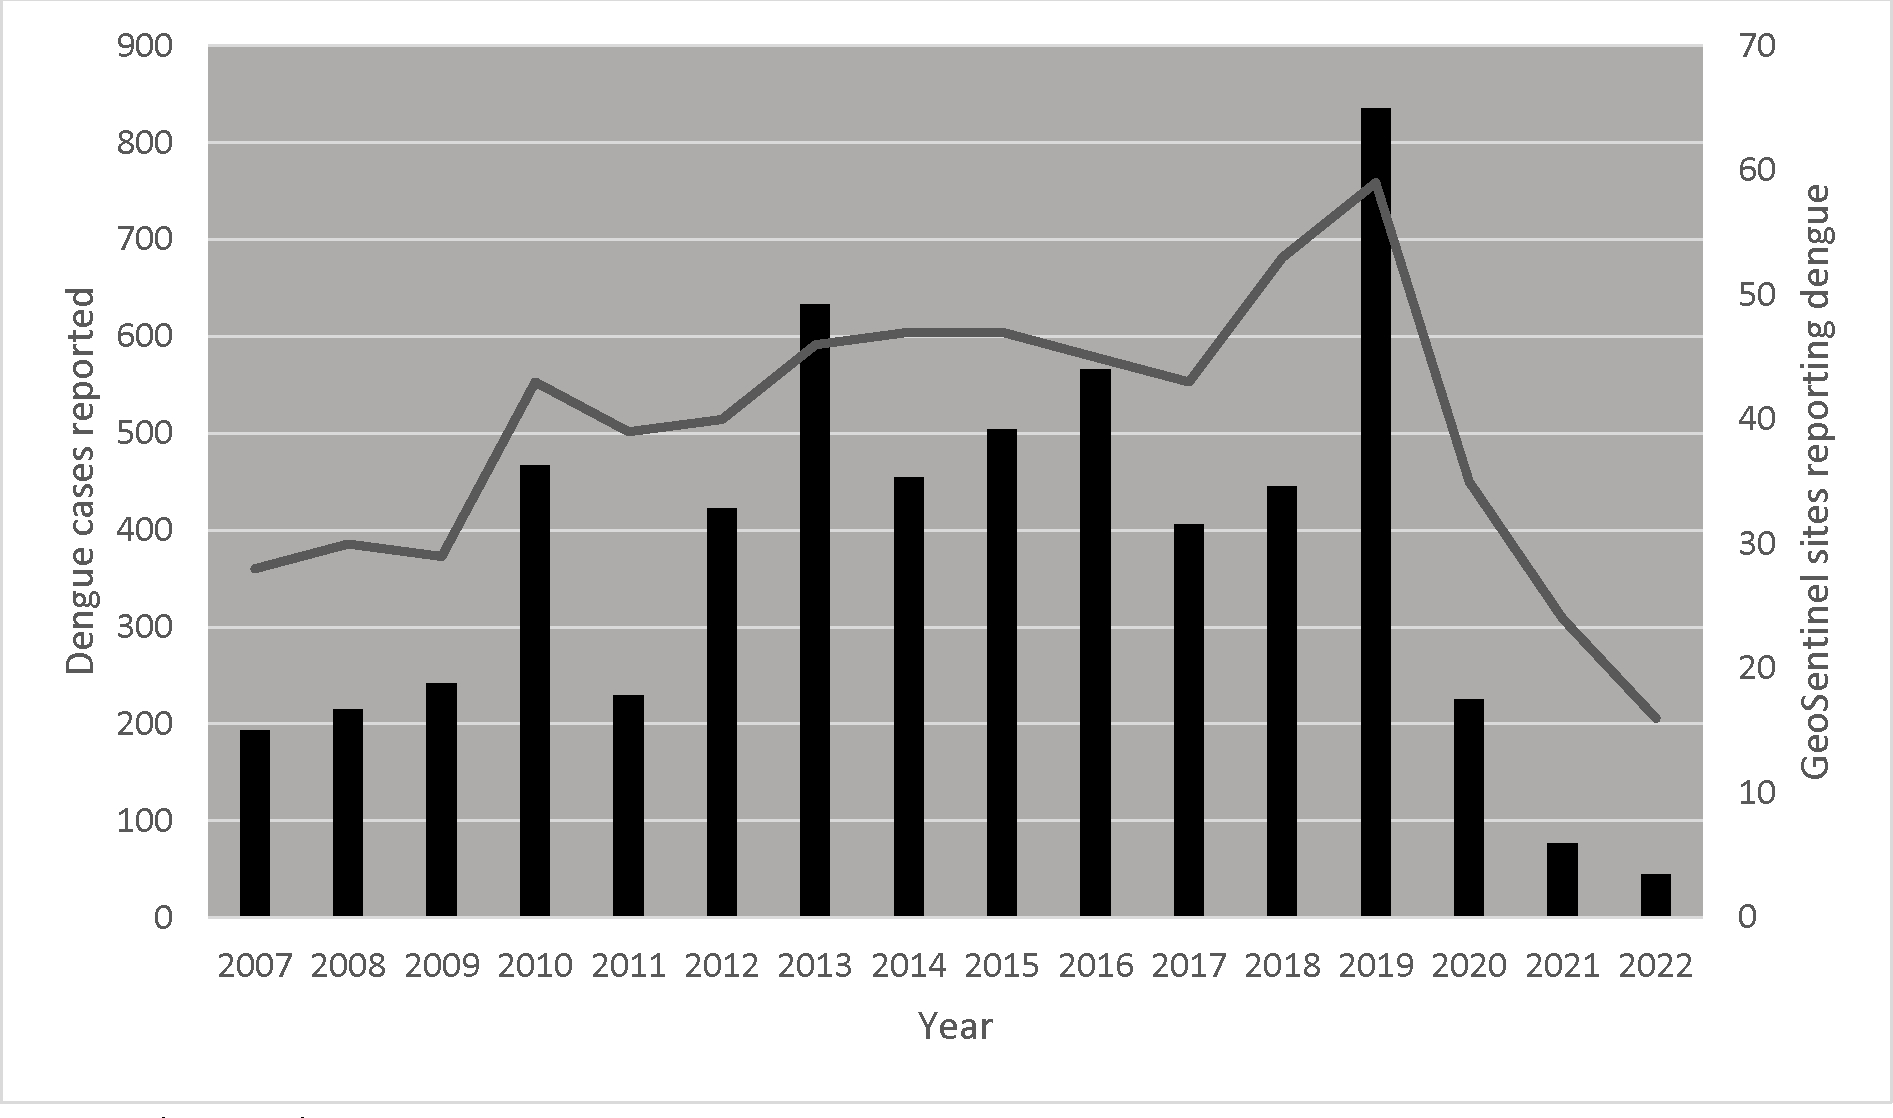
Figure 1. International travel-related dengue cases reported by year, GeoSentinel Network, January 1, 2007-May 31, 2022 (N=5,958).

The bars (left axis) represent the number of dengue cases reported by GeoSentinel sites, by year. The curve (right axis) represents the number of sites reporting at least one dengue case in that particular year.
