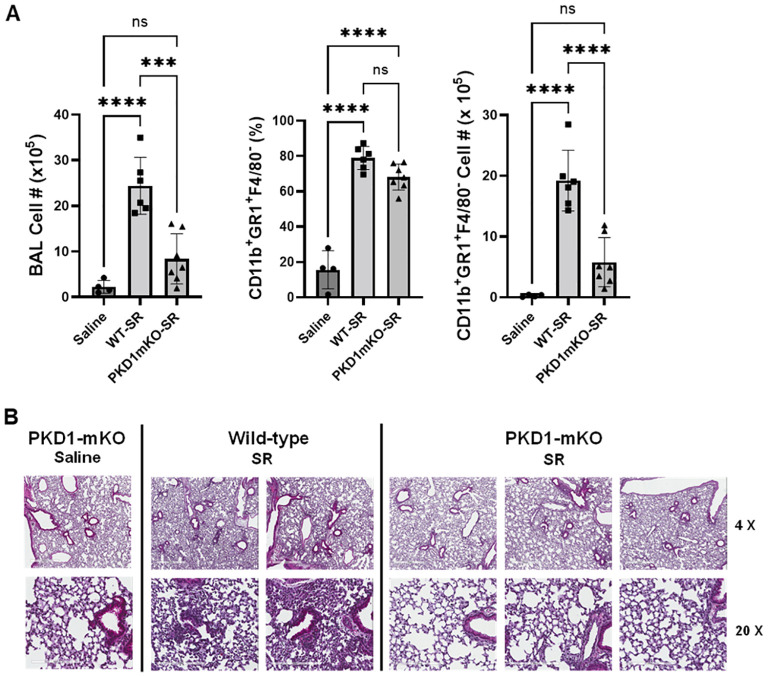
Figure 4.
PKD1 in myeloid lineage cells contributes significantly to the neutrophilic alveolitis developed following single exposure to S. rectivirgula. PKD1 fl/fl mice (WT) and PKD1 fl/fl -LyZ Cre mice (PKD1mKO) were exposed intranasally to saline or S. rectivirgula (80 μg) for 24 h. (A) BAL cells were counted using trypan blue exclusion and presented as the mean cell number ± SD (left panels). Total neutrophil cell count was derived by staining BAL cells with Abs to Gr-1, CD11b, and F4/80 followed by flow cytometric analysis. Gating strategy for flow cytometric analysis is shown in Supplementary Figure 2 . Neutrophils were identified as CD11b+Gr1+/F4/80-. The frequency of neutrophils is expressed as % in BAL cells, and data represent the mean (%) ± SD (middle panels). The number of neutrophils is presented as the mean cell number ± SD (right panels). Statistical differences were determined by one-way ANOVA with Tukey’s post-hoc test and significant differences are indicated (***p < 0.001; ****p < 0.0001). ns, not significant. (B) Representative H&E staining of the left lung lobe sections from mice exposed to saline or SR for 24 h are shown. The Aperio ScanScope®XT Slide Scanner system was used to capture whole-slide digital images. Each column represents the lung collected from an individual mouse. The images presented are 4× magnification (scale bar = 600 μm) and 20× magnification (scale bar = 200 µm). Number of mice used for each group is as follows: Saline, n = 3 to 11; WT-SR, n = 3 to 6; PKD1mKO-SR, n = 4 to 7.

