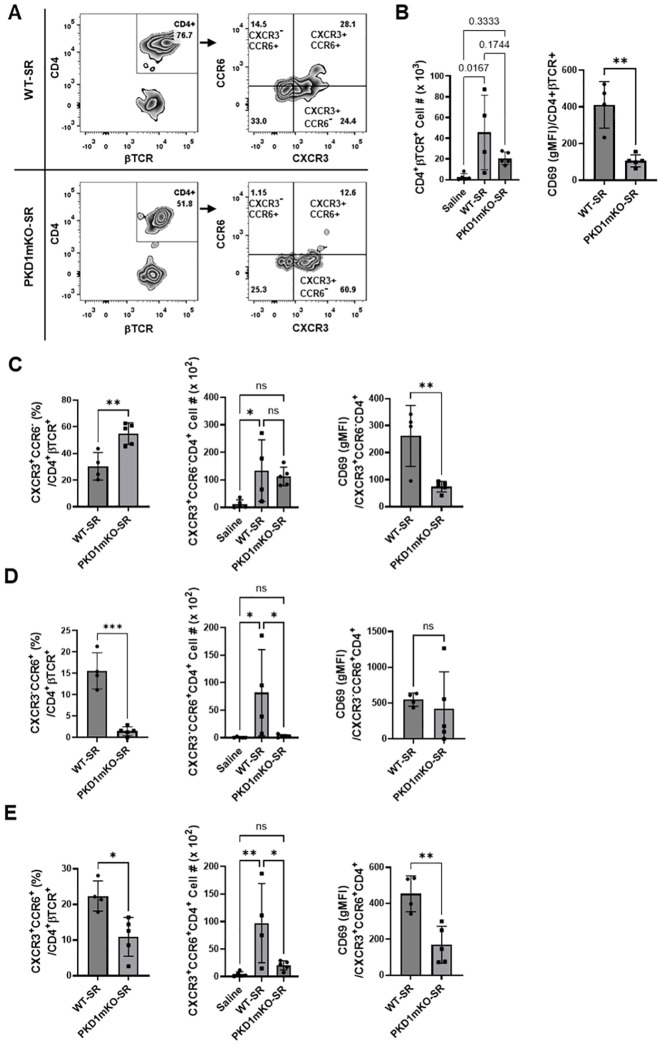
Figure 8.
Effects of myeloid lineage cell-specific PKD1 on CXCR3+CCR6+ cell accumulation in the lungs following repeated exposures to S. rectivirgula. PKD1 fl/fl mice (WT) and PKD1 fl/fl -LyZ Cre mice (PKD1mKO) were exposed intranasally to saline or SR (100 μg) three times per week for 3 weeks. Seventy-two hours after the last S. rectivirgula challenge, BAL cells were stained with fluorochrome-conjugated Abs and then analyzed by flow cytometry and FlowJo flow software. Gating strategies for flow cytometric analysis of CD4+ T cells in BAL cells are shown in Supplementary Figure 3A . (A) Gating of CD4+ T cells for CXCR3 and CCR6 expression. (B–E) The frequency of CXCR3+CCR6- cells, CXCR3-CCR6+ cells, or CXCR3+CCR6+ cells in the CD4+ T-cell population is expressed as % in the CD4+βTCR+ cell population. The number of CD4+βTCR+ cells, CXCR3+CCR6-CD4+βTCR+ cells, CXCR3-CCR6+CD4+βTCR+ cells, and CXCR3+CCR6+CD4+βTCR+ recovered from BAL was derived by staining BAL cells with Abs to CXCR3, CCR6, CD4, and βTCR followed by flow cytometric analysis. Levels of surface expression of CD69 on CXCR3+CCR6-CD4+ T cells, CXCR3-CCR6+CD4+ T cells, or CXCR3+CCR6+CD4+ T cells were determined by geometric mean fluorescent intensity (gMFI) of CD69 in each cell population. Data represent the mean ± SD. Significance was determined by two-tailed Student’s t-test (for two groups) or by one-way ANOVA with Tukey’s post-hoc test (for three groups). Statistically significant differences are indicated (*p < 0.05; **p < 0.01; ***p < 0.001). ns, not significant. Each symbol represents individual mouse. Number of mice used for each group is as follows: Saline, n = 4; WT-SR, n = 4; PKD1mKO-SR, n = 5.

