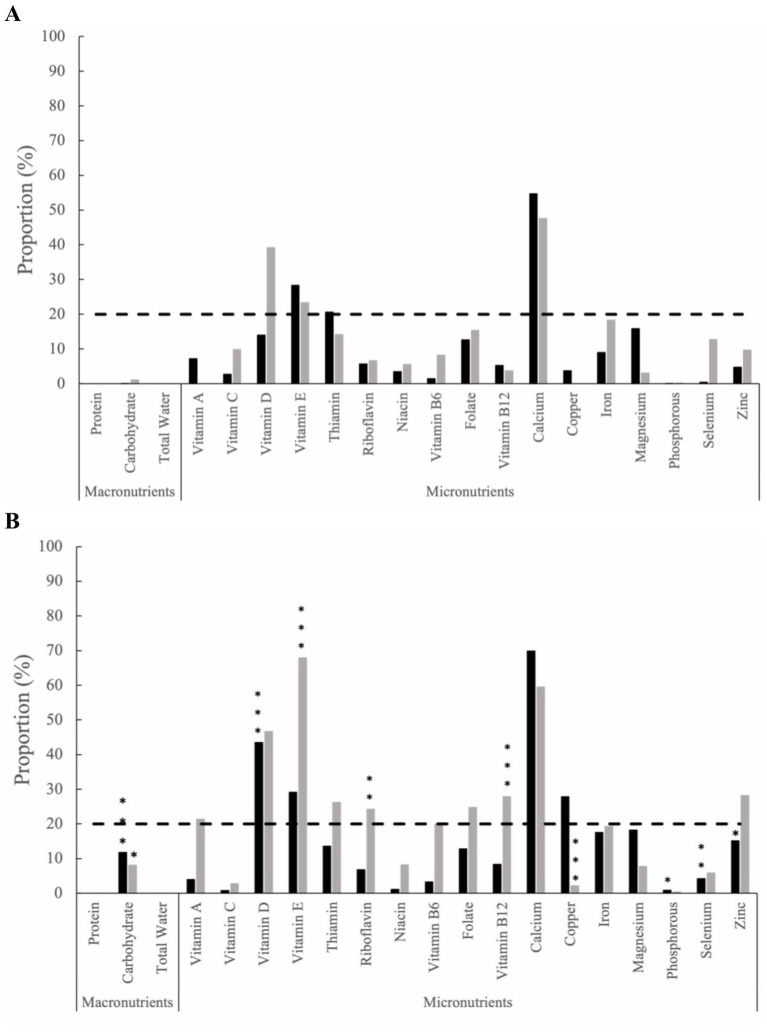
Figure 1.
The proportion of inadequate nutrient intake among the health behaviors group (black bars) and standard of care group (grey bars) from food and supplements at (A) baseline and (B) Month 12. The dashed line represents severe micronutrient inadequate intake, defined as ≥20% of the group. Statistical significance is determined by two sample z-tests. Within-group statistical significance compared to baseline values are indicated by * for (p ≤ 0.05), ** for (p ≤ 0.01), and *** for (p ≤ 0.001).

