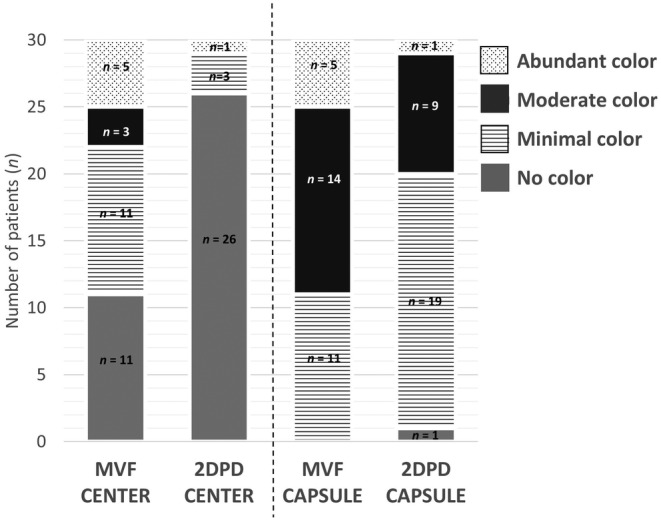
FIGURE 3.

Color score per fibroid. Data shown as number (n) of fibroids displaying a specific color score in the center and capsule as determined by MV‐flow (MVF) and 2D power Doppler (2DPD).

Color score per fibroid. Data shown as number (n) of fibroids displaying a specific color score in the center and capsule as determined by MV‐flow (MVF) and 2D power Doppler (2DPD).