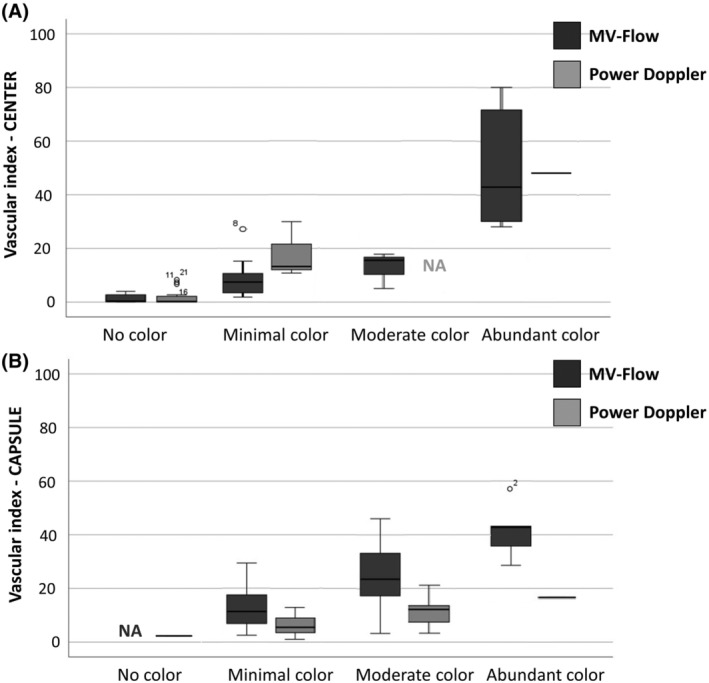
FIGURE 4.

Boxplots showing the relation between Color Score and Vascular Index for the fibroids' center (A) and the vascular capsule (B). The higher the subjective color score, the higher the vascular index for the target fibroid. This graph also shows, based on the depicted vascularity in the center, 2D MV‐flow imaging could distinguish all four categories, that is, no flow, minimal flow, moderate flow and abundant flow. 2D Doppler could only distinguish between no flow and minimal flow in the center. Data shown as median with interquartile range. MV, microvascular; 2D, two‐dimensional; PD, power Doppler; NA, not applicable (n = 0).
