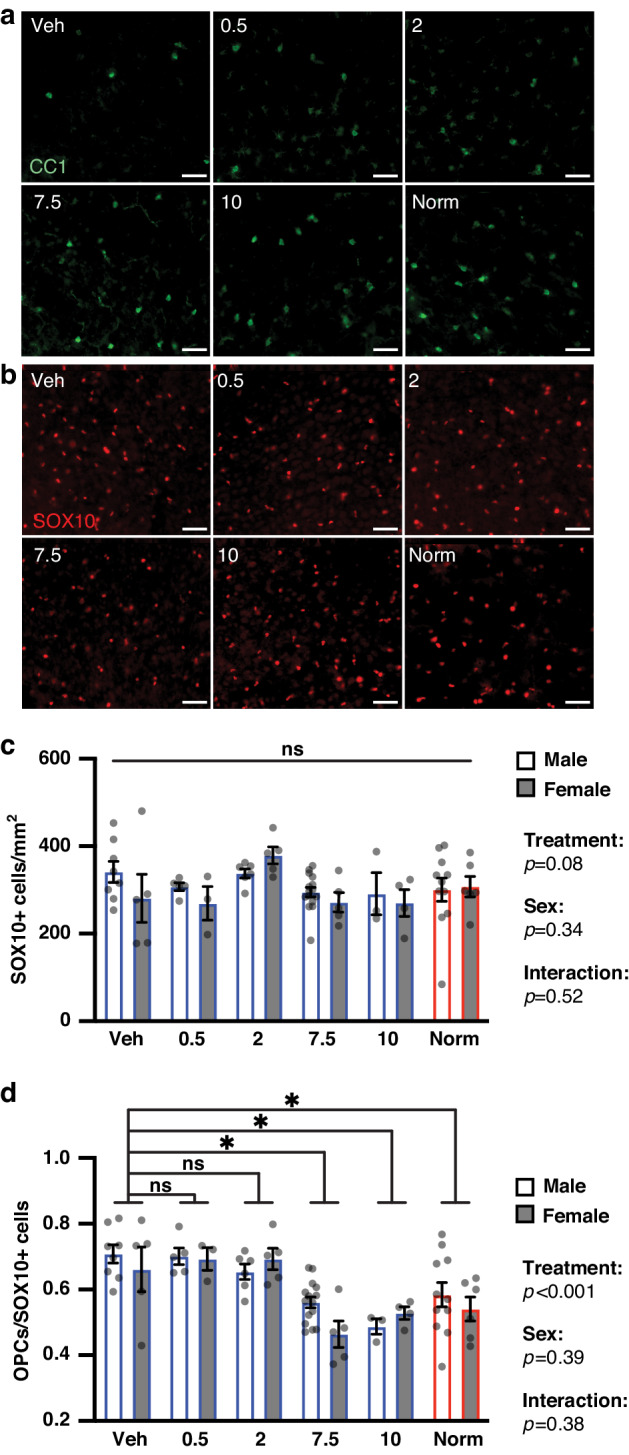
Fig. 2. Clemastine rescues hypoxia-induced deficits in oligodendrocyte differentiation.

a Representative images of staining for mature (CC1+) oligodendrocytes in the cortex of P14 mice from each treatment condition. Magnification: 20X; scale bars, 50 um. b Representative images of staining for oligodendrocyte lineage (SOX10+) cells in the cortex of P14 mice from each treatment condition. Magnification: 20X; scale bars, 50 um. c Bar graph of mean SOX10+ cell density in cortex by sex and treatment group. There was not a significant effect of treatment group, sex or interaction in a two-way ANOVA of treatment group and sex (predictors) with outcome of SOX10+ cell density; ns, not significant. Error bars represent S.E.M. d Bar graph of mean proportion of oligodendrocyte precursor cells (OPCs, defined as CC1-/SOX10+ cells) out of all oligodendrocyte lineage cells in cortex by sex and treatment group. There was a significant effect of treatment group, but not sex or interaction, in a two-way ANOVA of treatment group and sex (predictors) with outcome of CC1-/SOX10+ out of SOX10+ cells. Results of pairwise comparisons between mean OPCs out of SOX10+ cells of the vehicle group and other treatment groups are shown above the bar graph. *p < 0.05, two-way ANOVA followed by post hoc Dunnett’s tests; ns, not significant. Error bars represent S.E.M. For all graphs and images, hypoxia-exposed animals were: Veh (vehicle-treated), 0.5 (clemastine 0.5 mg/kg/day), 2 (clemastine 2 mg/kg/day), 7.5 (clemastine 7.5 mg/kg/day), 10 (clemastine 10 mg/kg/day). Norm, normoxia-exposed animals.
