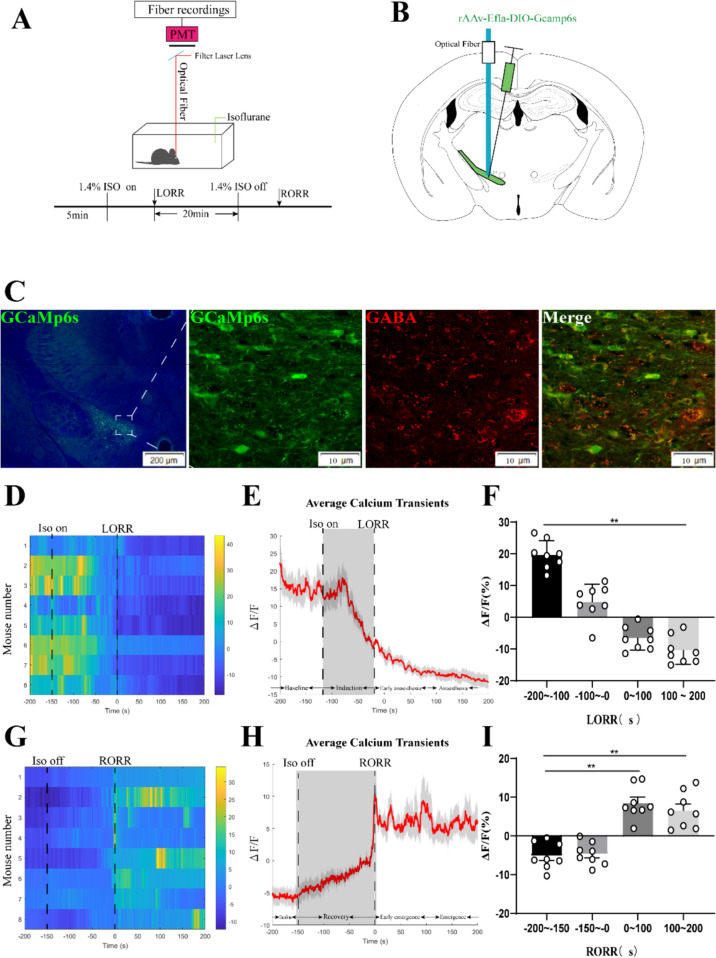
Fig. 1.
Phase-dependent calcium alterations in ZI GABAergic neurons during isoflurane anaesthesia. A Top: Schematic diagram of fiber photometry recording during isoflurane anesthesia in freely moving mice. Bottom: Timeline for quantifying the LORR and RORR of isoflurane anesthesia. (PMT, Photomultiplier tube is a kind of detection device that can convert weak light signals into electronic signals and amplify them). B Schematic of calcium signal recording model into the ZI of a VGAT -Cre mouse. C Expression of GCaMP6f in the ZI of a VGAT -Cre mouse. Viral expression (GCaMP6s, green) in the ZI and colabeling with GABA neurons (GABA immunofluorescence, red). D Individual transitions from wakefulness to isoflurane-induced LORR with color-coded fluorescent intensities (LORR were represented the point of 0). E Average responses from the state transitions during the process of induction expressed as the mean (red) ± SEM (shaded). (F) The fluorescence calcium signals significantly reduced after isoflurane-induced unconsciousness (The baseline (wake: − 200 to − 100 s) vs. anaesthesia period (100 to 200 s), P = 0.0475; n = 8), the paired Student’s t-tests). G Individual transitions from isoflurane anesthesia state to arousal with color-coded fluorescent intensities (RORR were represented the point of 0). H Average responses from the state transitions during the process of recovery expressed as the mean (red) ± SEM (shaded). I The fluorescence calcium signals ascended after RORR (The baseline (anaesthesia: − 200 to − 150 s) vs. early emergence period (0 to 100 s); P = 0.0055; The baseline: (anaesthesia: − 200 to − 150s) vs. emergence period (100 to 200 s), P = 0.0026; the paired Student’s t-tests; n = 8, *P < 0.05, **P < 0.01)

