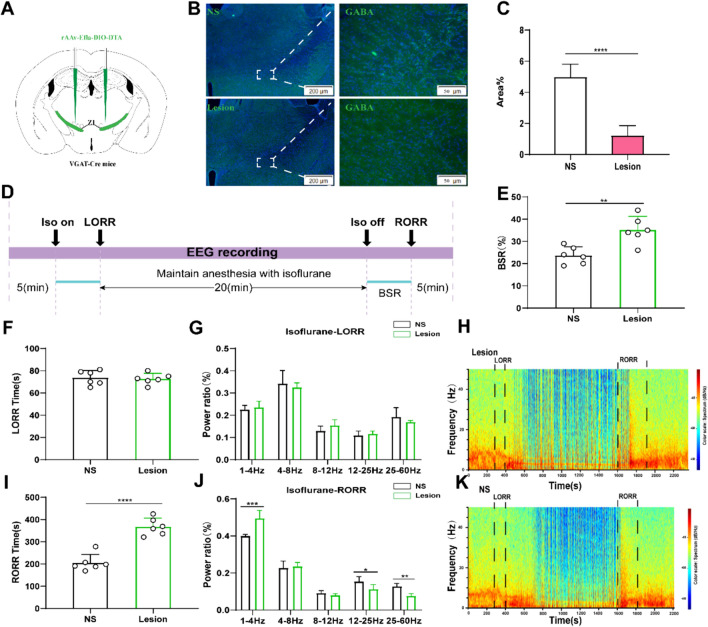
Fig. 2.
Lesion of ZI GABAergic neurons delayed arousal from isoflurane anesthesia. A Schematic showing bilateral injection of Cre-independent AAVs into the ZI. B Image showing GABA staining from a mouse with specific ZI lesion using AAV-CAG-DIO-DTA (NS represents normal saline). C Proportions of GABA-fluorescent area in ZI, indicating that the lesion group animals were selectively ablated ZI GABAergic neurons (P = 0.0001 by independent-samples t-test; n = 6 per group). D Protocol for behavioral and electroencephalogram (EEG) recording of induction time and emergence time. Spectrograms of EEG power during the isoflurane anaesthesia period in the control group. E BSR at recovery process of isoflurane in control group and lesion group (P = 0.0001 by independent-samples t-test; n = 6 per group). F The induction time in control group and lesion group during the maintenance of 1.4% isoflurane anesthesia. G Lesion of ZI GABAergic neurons displaying no significant change in the power ratios of the EEG. Spectrograms of EEG power during the isoflurane anaesthesia period in lesion group (H) and the control group (K). I Lesion of ZI GABAergic neurons peolonged the recovery time from 1.4% isoflurane anesthesia. (J) During the recovery time, lesion of ZI GABAergic neurons significantly altered the power ratios of the EEG. (δ band: lesion group vs. control group; P = 0.0003 by independent-samples t-test;β band: lesion group vs. control group; P = 0.018 by independent-samples t-test, γ band: lesion group vs. control group; P = 0.01 by independent-samples t-test; n = 6 per group)

