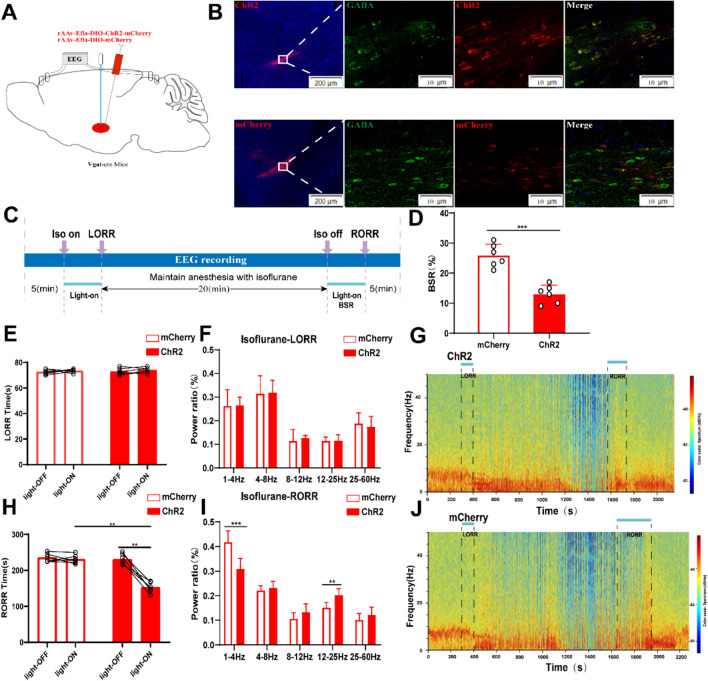
Fig. 3.
Optogenetic activation of ZI GABAergic neurons facilitates arousal from isoflurane anesthesia. A Diagram of the optogenetic virus injection and stimulation sites in ZI. B Expression of virus (ChR2 and mCherry, red) in ZI GABAergic neurons and colabeling with GABA (GABA immunofluorescence, green). C Protocol for optogenetic activation during isoflurane anesthesia. D Optical activation of ZI GABAergic neurons reduced the ratio of BSR in the recovery period. E Optical activation of ZI GABAergic neurons did not change induction time (LORR: mcherry-light-on vs. ChR2-light-on, P = 0.6, independent-simples t-test; ChR2-light-on vs. ChR2-light-off. P = 0.2, paired t-test). F, I Comparison of each EEG frequency band between the two groups during optogenetic activation of ZI GABAergic neurons. Spectrograms of EEG power during the isoflurane anaesthesia period in ChR2 group G and the mCherry group (J). H Optical activation of ZI GABAergic neurons shortened emergence time from 1.4% isoflurane anesthesia (RORR: mcherry-light-on vs. ChR2-light-on, P = 0.0009, independent-simples t-test; ChR2-light-on vs. ChR2-light-off. P = 0.0002, paired t-test). Representative EEG heatmap of the process in the two groups

