Fig. 2.
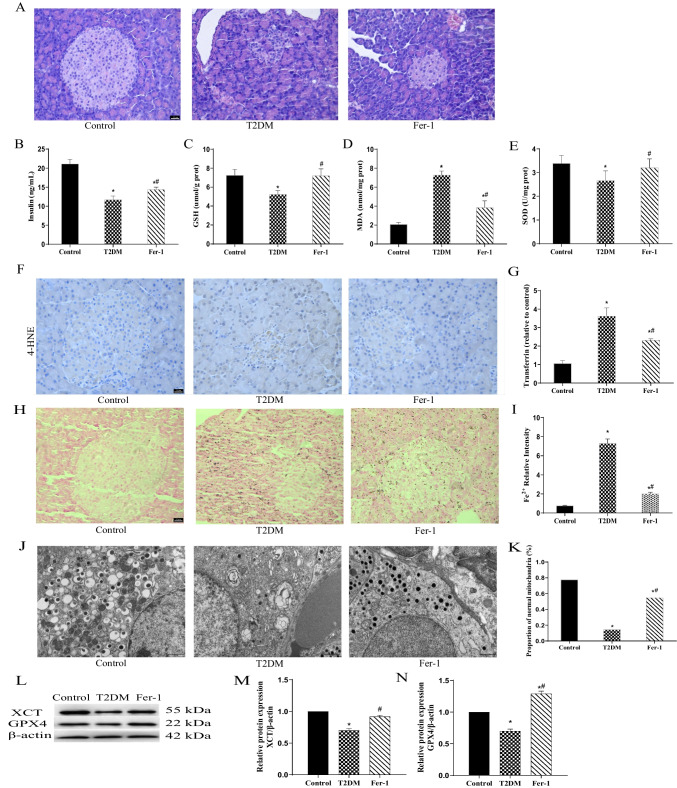
Ferroptosis of pancreatic tissue is activated in T2DM rats. A HE staining of rat pancreatic tissues (magnification × 400). B Insulin levels were measured using rat-specific ELISA kits. C–E Glutathione (GSH) (C), malondialdehyde (MDA) (D), and superoxide dismutase (SOD) levels (E) were detected in pancreatic homogenates. F The protein expression of 4-HNE detected using immunohistochemical staining (magnification × 400). G Quantification of transferrin using rat-specific ELISA kits. H Lillie staining was used to detect ferrous iron content (blue) in pancreatic tissue (magnification × 400). I quantification of the ferrous iron content (× 400). J Transmission electron microscope observation of mitochondrial structures in the pancreas. K The proportion of normal mitochondria. L XCT and GPX4 protein expression levels in pancreatic tissue detected using western Blot analysis. M, N Quantified XCT (M) and GPX4 (N) protein levels. Data are expressed as mean ± SD (*P < 0.05 vs. Control; #P < 0.05 vs. T2DM)

