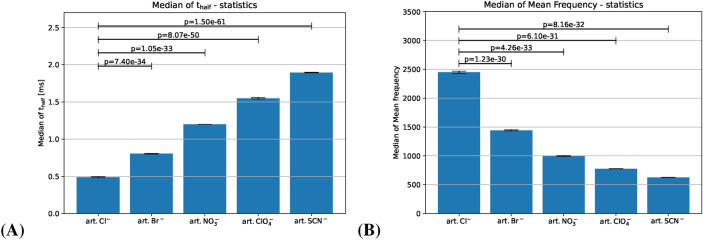
Figure 3.
FFT on simulated signals: (A) Spike characteristics in the time domain shown by median of . (B) Spike characteristics in the frequency domain shown by median of mean frequency, . Hofmeister-like arrangement of mean frequency in the simulated spike trains (“art” stands for artificial). Standard error of mean of the median of and the median of mean frequency are shown by the error bars. Bars represent the mean of the medians of t-half across multiple simulated signals, with error bars representing the standard error of the mean of the medians.....

