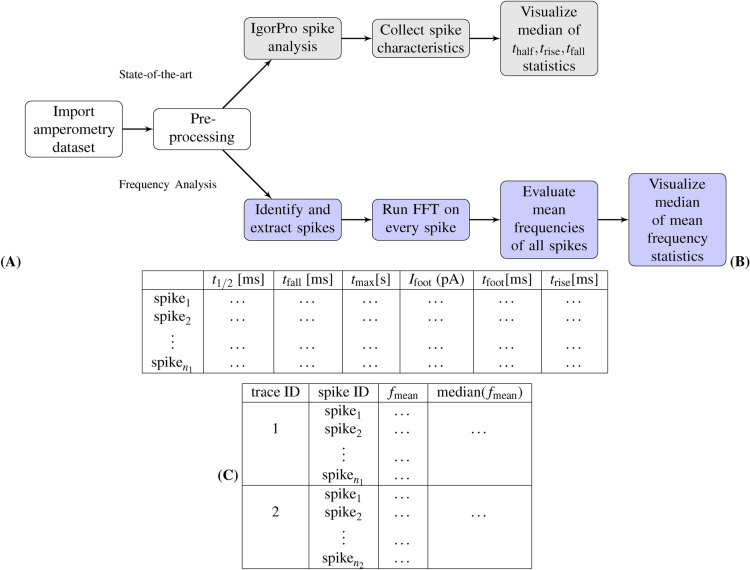
Figure 7.
Analysis of amperometry traces: (A) a comparison between the workflow adopted by the “state-of-the-art” method, which uses QuantaAnalysis to analyze time-domain spike parameters of the trace, and the proposed “frequency analysis” method, which analyzes the spikes in the frequency domain. (B) shows an overview of the output time, current and charge parameters in the time domain. (C) shows an overview of the output parameters in the frequency domain, mean frequencies and their median within each trace. The frequency analysis method provides a statistical validation for the state-of-the-art.

