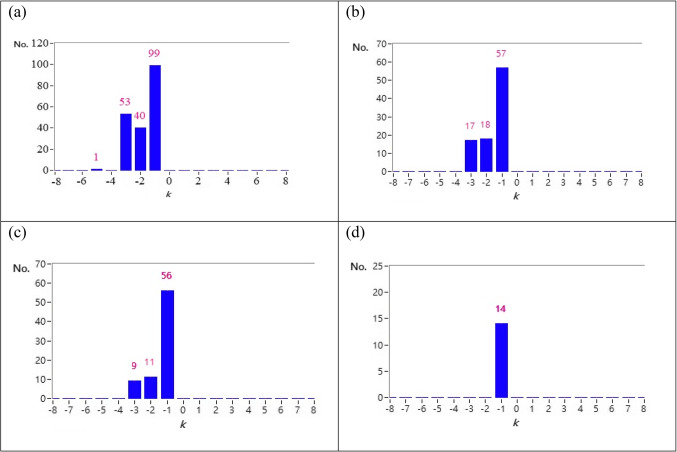
Fig. 2.
(a) bar chart for maximum ACCF index distribution for a typical POTS subject that 193 curves satisfy the threshold by -5≦k≦5 and max ACCF(k)>0 (b) bar chart for maximum ACCF index distribution for a typical POTS subject that 92 curves for a typical POTS subject satisfy the threshold by -5≦k≦5 and max ACCF(k)>0.3 (c) bar chart for maximum ACCF index distribution for a typical POTS subject that 76 CCF curves for a typical POTS subject with curves satisfy the threshold by-5≦k≦5 and max ACCF(k)>0.5 (d) bar chart for maximum ACCF index distribution for a typical POTS subject that 14 curves for a typical POTS subject with satisfy the by -5≦k≦5 and max ACCF(k)>0.7.

