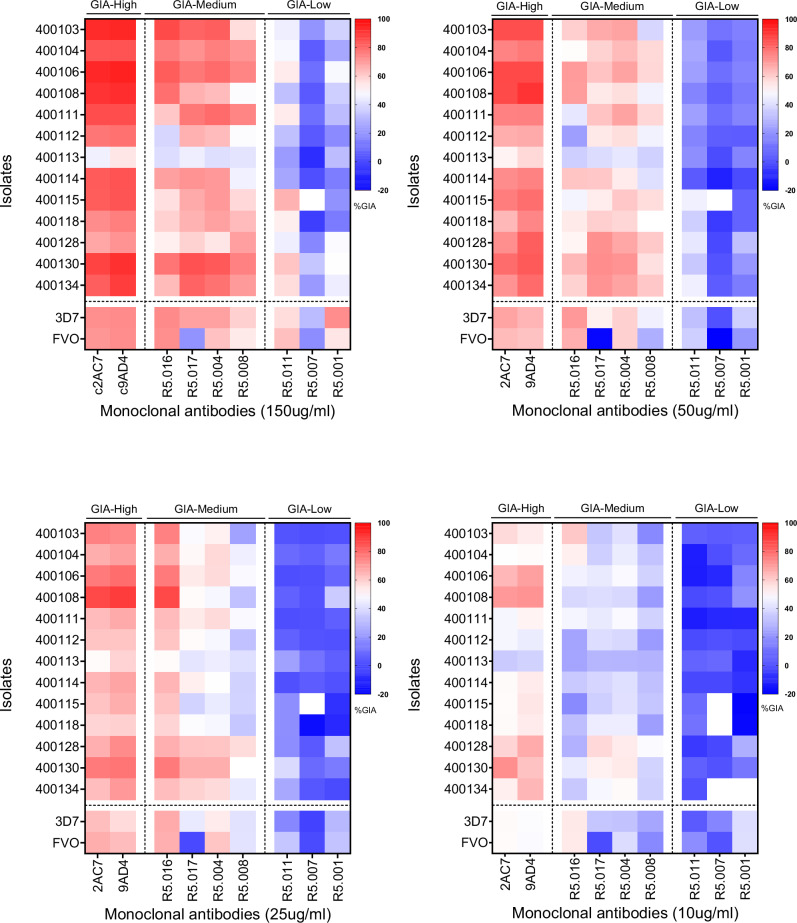
Fig. 2. Classification of the GIA profiles of PfRH5-vaccine-induced mAbs against P. falciparum clinical isolates.
Heat maps presenting the percent GIA data of mAbs to PfRH5 tested at different concentrations (150; 50; 25 and 10 µg/ml). The GIA data from Fig. 1 were used to classify the mAbs in this panel into three main groups, GIA-high (GIA ≥ 75% at 150 µg/ml), GIA-medium (75% > GIA ≥ 50% at 150 µg/ml) or GIA-low (GIA < 50% at 150 µg/ml) separated by vertical dotted lines. Horizontal dotted lines depict the separation between P. falciparum clinical isolates and laboratory lines, presented in the y-axis of the graphs.

