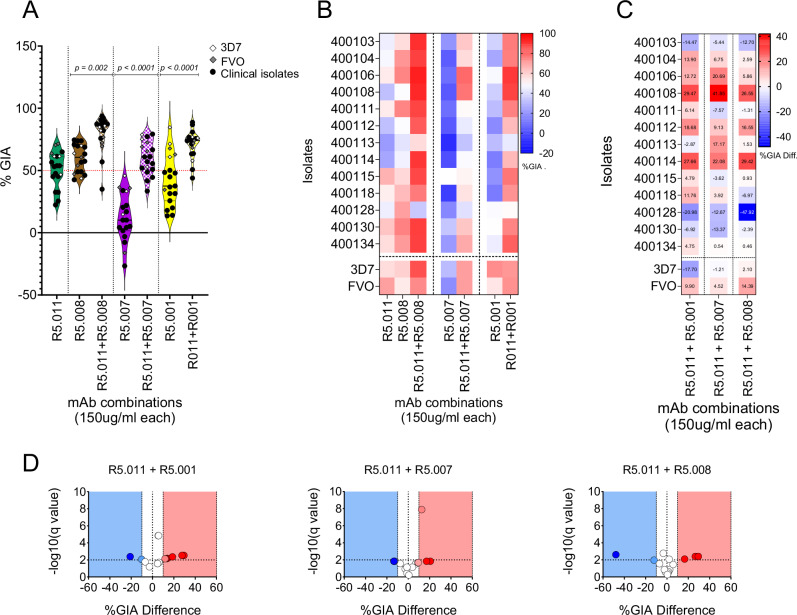
Fig. 4. Assessment of GIA in combinatorial assays of anti-PfRH5 mAbs tested against P. falciparum clinical isolates (N = 13).
A Violin plots showing percent GIA from combinations of R5.011 (green) with either R5.001 (yellow), R5.007 (purple) or R5.008 (brown). Depicted in the plots are the mean percent GIA (plain black line) and the 25th and 75th quartiles (dotted black lines). Here, mAbs were combined in equal concentrations and incubated with equal volumes of either P. falciparum clinical isolates (black dots) or laboratory lines (diamond shapes). The resulting GIA was compared to the single antibody at the same concentration. All assays were performed in duplicates and the data are presented as means from the two replicates. Statistical differences between antibody combinations and single antibody treatments were computed in GraphPad Prism using the Wilcoxon matched-pairs signed rank test. B Heat map showing the GIA profiles of antibody combinations (x-axis) against P. falciparum parasites (y-axis). The dotted vertical lines separate the different antibody combinations, while P. falciparum clinical isolates are separated from the laboratory lines by the horizontal dotted line. C heat maps and D Volcano plots depicting the difference between the Bliss additivity predicted percent GIA and the actual percent GIA from mAb combinations. Bliss analysis was calculated as previously described35 and the multiple unpaired t-test was used to assess the statistical difference. Volcano plots show −log10 of the q-values.

