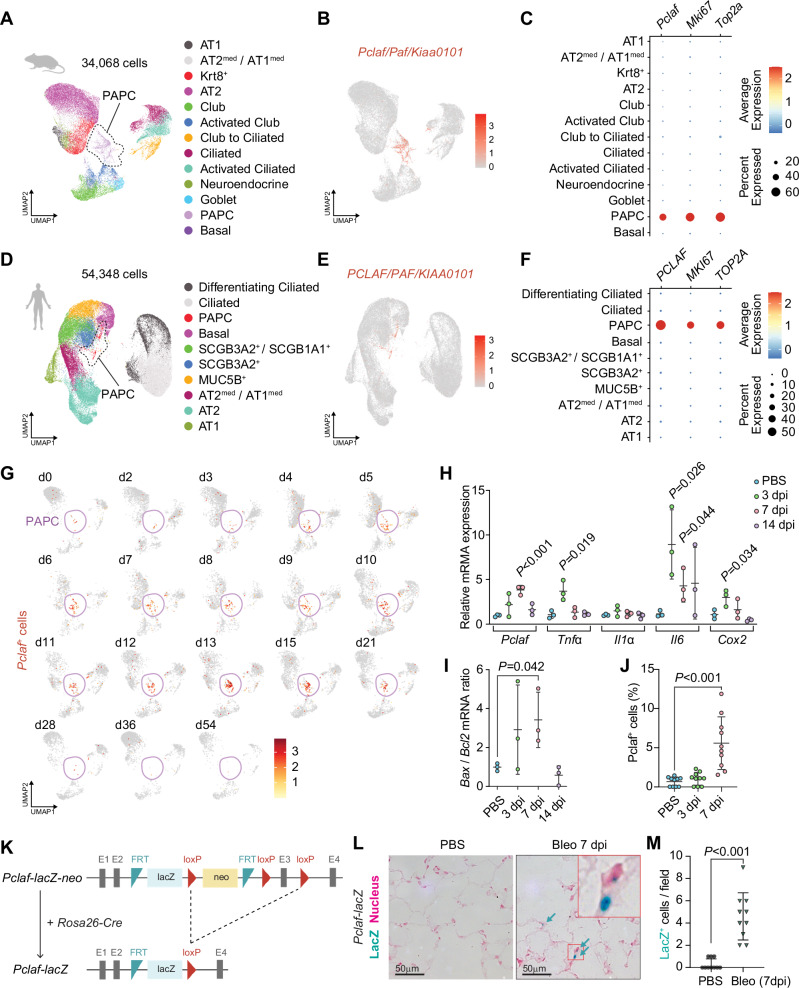
Fig. 1. Pclaf+ cells are elevated during lung regeneration.
A–C A public scRNA-seq dataset (GSE141259) was generated by subjecting sorted cells from the mouse lung epithelial compartment at 18 different time points after bleomycin instillation. Uniform manifold approximation and projection (UMAP)-embedding displays cells colored by cell type identity (A). Feature plot of Pclaf expression (B). Dot plots showing Pclaf, Mki67, and Top2a gene expression in each cell type (C). D–F A public scRNA-seq dataset (GSE135893) was generated from the human lung cells of 20 pulmonary fibrotic diseases and 10 control lungs. UMAP embedding displays cells colored by cell type identity (D). Feature plot of expression of PCLAF (E). Dot plots for PCLAF, MKI67, and TOP2A gene expression in each cell type (F). G Feature plots of Pclaf expression in mouse lung at the indicated time points using data shown in (A). H–J Mouse lungs (n = 3) were collected after bleomycin (1.4 U/kg) had been added to the trachea at the indicated time points. RT-qPCR analysis of the Pclaf, Tnfα, Il1α, Il6, and Cox2 mRNA level (H) and the ratio of Bax/Bcl2 mRNA level (I). Quantification of Pclaf+ cells by immunostaining (J). K Scheme of establishing Pclaf-lacZ knock-in mice. The neo cassette was deleted by breeding Pclaf-lacZ-neo with Rosa26-Cre driver. L, M Representative images of X-gal staining. Pclaf-lacZ mice were instilled with bleomycin (1.4 U/kg; n = 10; Bleo) or PBS (0 dpi; n = 10). At 7 dpi, lungs were collected and stained for X-gal (5-bromo-4-chloro-3-indolyl-β-D-galactopyranoside; blue) and nuclear fast red (pink) (L). Quantification of lacZ+ cells (M). Two-sided Student’s t-test; error bars: mean +/− standard deviation (SD). Represented data are shown (n ≥ 3). Source data are provided as a Source Data file. Graphic icons were created with BioRender.com.

