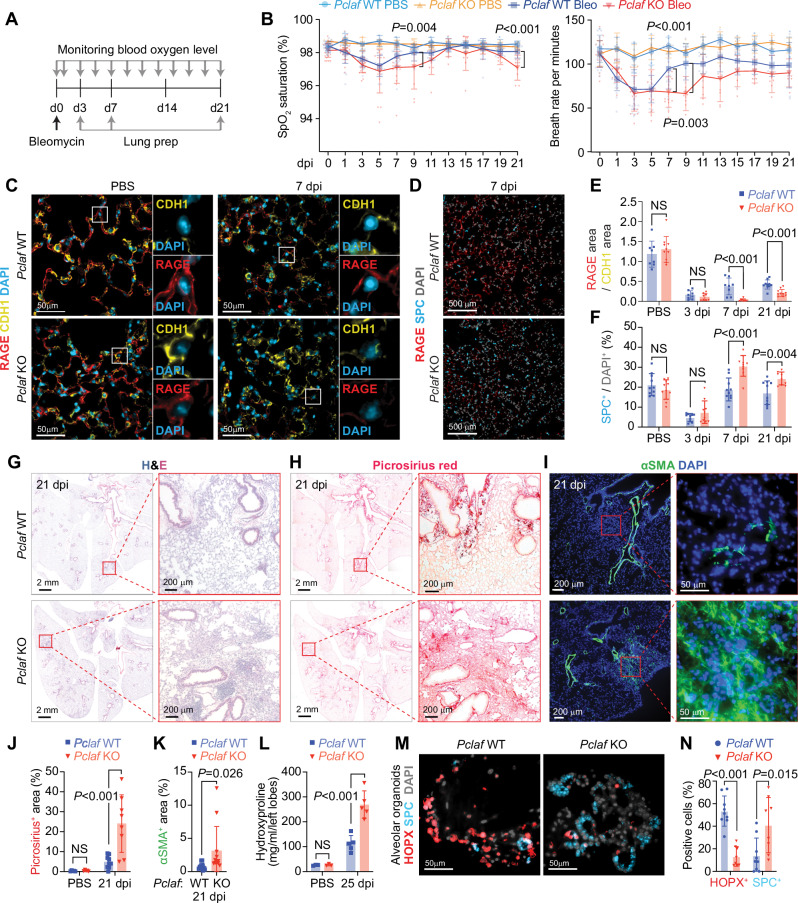
Fig. 2. Pclaf KO impairs lung regeneration.
A Experimental scheme for the bleomycin-induced lung injury model. Pclaf WT and KO mice were treated with PBS (n = 5 for Pclaf WT, n = 5 for Pclaf KO) or bleomycin (1.4 U/kg; n = 25 for Pclaf WT, n = 24 for Pclaf KO; Bleo) by intratracheal instillation. The blood oxygen level (SpO2) and breath rate were measured by pulse-oximetry at the indicated time points. At 3 days after injury (dpi, n = 7 for each group with bleomycin), 7 dpi (n = 8 for each group with bleomycin), and 21 dpi (n = 10 for Pclaf WT, n = 8 for Pclaf KO with bleomycin, n = 5 for each group with PBS (21 dpi)), the lungs were collected for further analysis. B The dynamics of SpO2 levels (left panel) and breath rate per minute (right panel) were measured at the indicated time points. Pclaf WT and KO with PBS (n = 5); Pclaf WT with bleomycin until 3 dpi (n = 25); 5 dpi and 7 dpi (n = 18), after 9 dpi (n = 10); Pclaf KO with bleomycin until 3 dpi (n = 24); 5 dpi and 7 dpi (n = 17), 9–15 dpi (n = 9), after 17 dpi (n = 8). C Representative immunostaining images for RAGE (AT1) and CDH1 (Epithelial cell) in PBS-instilled lung and 7 dpi of bleomycin-instilled lung. D Representative images of immunostaining for RAGE and SPC (AT2 cells) at 7 dpi. E Quantification of RAGE+ area/CDH1+ area. Pclaf WT with PBS (n = 8), 3 dpi (n = 8), 7 dpi (n = 8), and 21 dpi (n = 10); Pclaf KO with PBS (n = 10), 3 dpi (n = 8), 7 dpi (n = 9), and 21 dpi (n = 10). F Quantification of SPC+ cells. n = 10 for each strain at indicated time point. G Representative images of hematoxylin and eosin (H&E) staining at 21 dpi. H Representative images of picrosirius staining (collagen fiber) at 21 dpi. I Representative images of immune-staining for alpha-smooth muscle actin (αSMA/Acta2; smooth muscle cell) at 21 dpi. J Quantification graphs of the picrosirius+ area. Pclaf WT or Pclaf KO with PBS (n = 5) or bleomycin at 21 dpi (n = 10). K Quantification graphs of the αSMA+ area. n = 12 for each strain. L Quantification of hydroxyproline contents in the left lobe of bleomycin (n = 5) or PBS-instilled (n = 3) lung at 25 dpi. M, N The lung epithelial cells were isolated from bleomycin-treated lungs of Pclaf WT or Pclaf KO mice at 7 dpi by MACS. The lung epithelial cells (TER119-/CD31-/CD45-/EPCAM+) were cultured with lung endothelial cells (CD31+) at a liquid-air interface to generate LOs. Representative Images of alveolar type organoids fluorescently immunostained for HOPX (AT1) and SPC (M). Quantification graph of HOPX+ and SPC+ cells. Pclaf WT (n = 9) or Pclaf KO (n = 8) (N). Two-sided Student’s t-test; error bars: mean +/− SD. Represented images are shown (n ≥ 3). Source data are provided as a Source data file.

