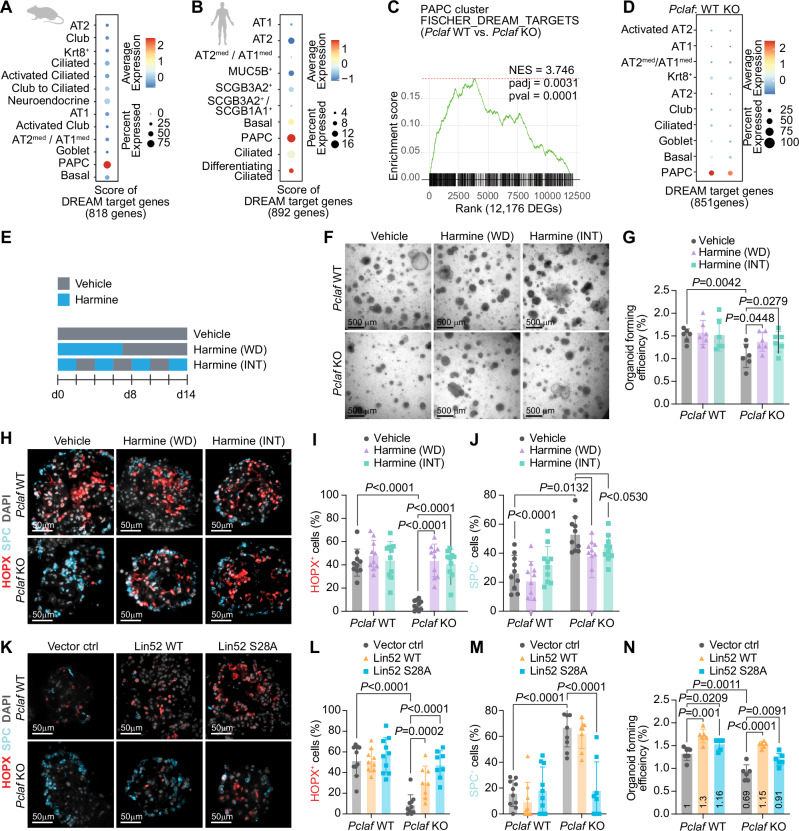
Fig. 4. PCLAF-DREAM axis mediates AT2 cell lineage plasticity for lung regeneration.
A Dot plots depicting transcriptional module scores of the gene sets of DREAM-target genes with the mouse scRNA-seq dataset shown in Fig. 1A. B Dot plots depicting transcriptional module scores of the gene sets of DREAM-target genes with the human scRNA-seq dataset shown in Fig. 1D. C Gene set enrichment analysis (GSEA) of Pclaf WT vs. Pclaf KO in the PAPC cluster using the dataset shown in Fig. 3. The enrichment plot presents the gene sets of DREAM-target genes. D Dot plots depicting transcriptional module scores of the DREAM-target gene set using the dataset shown in Fig. 3. E Experimental scheme for LO culture under stimuli of harmine (200 nM). Harmine was used to treat LOs for the first 7 days and withdrawn (WD). Alternatively, LOs were cultured with harmine intermittently (INT) at the indicated time points. F The representative bright-field z-stack images of LOs on day 12. G Quantification graph of lung OFE (n = 6). H Representative images of IF staining for HOPX and SPC on day 14. I, J Quantification graph of HOPX+ (n = 10) (I) and SPC+ cells (n = 10) (J). K–N Isolated lung epithelial cells were transduced with RFP, Lin52 WT, or Lin52 S28A by lentivirus and then cultured with LO. Representative images of IF staining for HOPX and SPC on day 14 (K). Quantification graph of HOPX+ (n = 10) (L) and SPC+ cells (n = 10) (M). Quantification graph of lung OFE (n = 6) (N). Two-sided Student’s t-test; error bars: mean +/− SD. Represented images and data are shown (n ≥ 3). Source data are provided as a Source data file. Graphic icons were created with BioRender.com.

