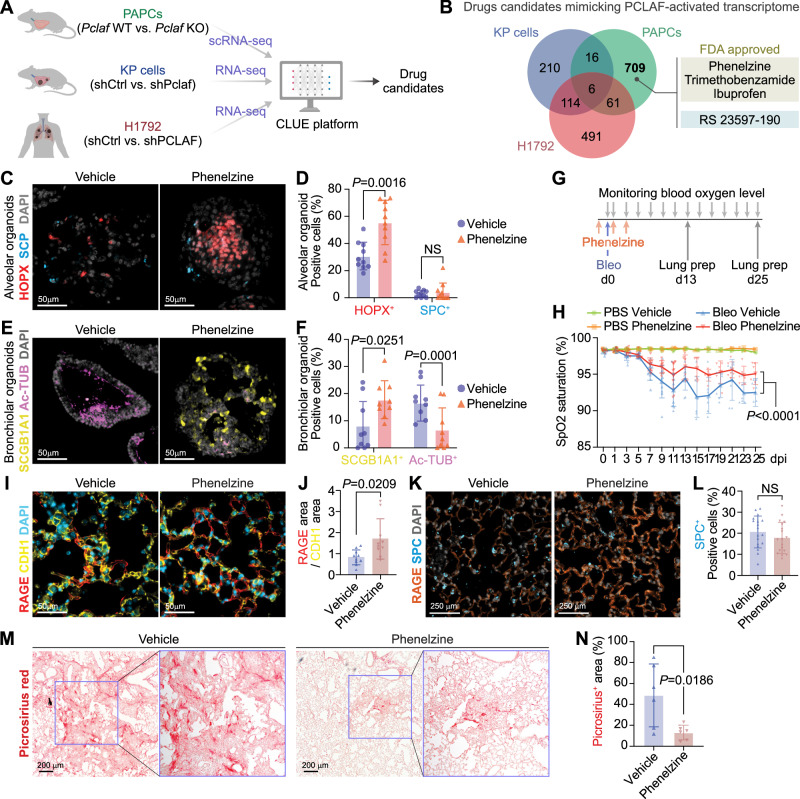
Fig. 6. Pharmacological mimicking of PCLAF-DREAM-activated transcriptional signature restores lung regeneration.
A Experimental scheme to identify drug candidates by the CLUE platform. B Venn diagram of Connectivity Map results, identifying drug candidates specific to normal lung PAPCs. C Representative images of LOs with phenelzine (10 μM) that fluorescently immunostained for HOPX and SPC. D Quantification graph of HOPX+ and SPC+ cells (n = 10). E Representative images of LOs with phenelzine (10 μM) that fluorescently immunostained for SCGB1A1 (Club) and Ac-TUB (Ciliated). F Quantification graph of SCGB1A1+ and Ac-TUB+ cells (n = 9). G Experimental scheme for bleomycin-induced lung regeneration by phenelzine. Mice were treated with bleomycin (2.8 U/kg) by intratracheal instillation. The vehicle control (DMSO, n = 10) or phenelzine (n = 10; 750 μg/head) were administered via intraperitoneal injection at −1, 1, and 3 dpi. The blood oxygen level (SpO2) and breath rate were measured by pulse-oximetry every other day. At 13 dpi (n = 4 for each group) and 25 dpi (n = 6 for each group), lungs were collected for further analysis. H The dynamics of spO2 levels were measured at the indicated time points. Two-way ANOVA with post-hoc Tukey test. PBS with vehicle or phenelzine until 13 dpi (n = 4) and after 15 dpi (n = 2); bleomycin with vehicle until 13 dpi (n = 10) and after 15 dpi (n = 7); bleomycin with phenelzine until 7 dpi (n = 10), 9–13 dpi (n = 9), and after 15 dpi (n = 6). I Representative images of the lungs at 13 dpi, fluorescently immunostained for RAGE (AT1) and CDH1 (Epithelial cell). J Quantification graph of RAGE+/CDH1+ area (n = 10). K Representative images of the lungs at 13 dpi, fluorescently immunostained for RAGE (AT1) and SPC (AT2). L Quantification graph of SPC+ cells (n = 18). M Representative images of picrosirius staining at 25 dpi. N Quantification graphs of the picrosirius+ area (n = 6). Two-sided Student’s t-test except for (H); error bars: mean +/− SD. Representative images are shown (n ≥ 3). Source data are provided as a Source data file. Graphic icons in Figure A were created with BioRender.com.

