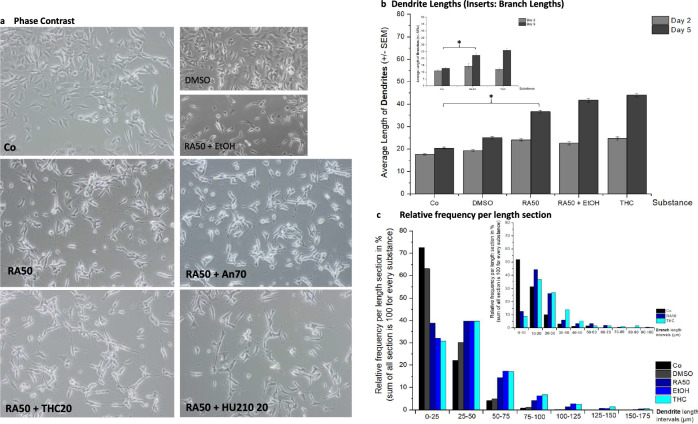
Fig. 1. Morphology and dendrite lengths.
a A representative phase contrast picture of every cell culture condition is depicted: undifferentiated control cells (Co), differentiated cells (treated with 50 µM retinoic acid, RA50), and differentiated cells additionally treated with 20 µM THC (THC20), anandamide 70 µM (An70), or HU210 20 µM (HU210 20). The smaller pictures show controls for the solvents of RA (DMSO) and THC (Ethanol, EtOH). b The average dendrite length of undifferentiated control cells (Co), differentiated cells (treated with 50 µM retinoic acid, RA50), and differentiated cells additionally treated with 20 µM THC (THC20) on day 2 and day 5. Additionally, controls for the solvents of RA (DMSO) and THC (Ethanol, EtOH) are shown. The smaller insert also indicates branch lengths for the three main conditions. Significant differences are indicated by *. c The presentation of the relative frequencies per length section (25 µm intervals) shows the distribution of different neurite lengths per condition. The smaller insert gives the same information for branches in 10 µm-intervals for the three main conditions.

