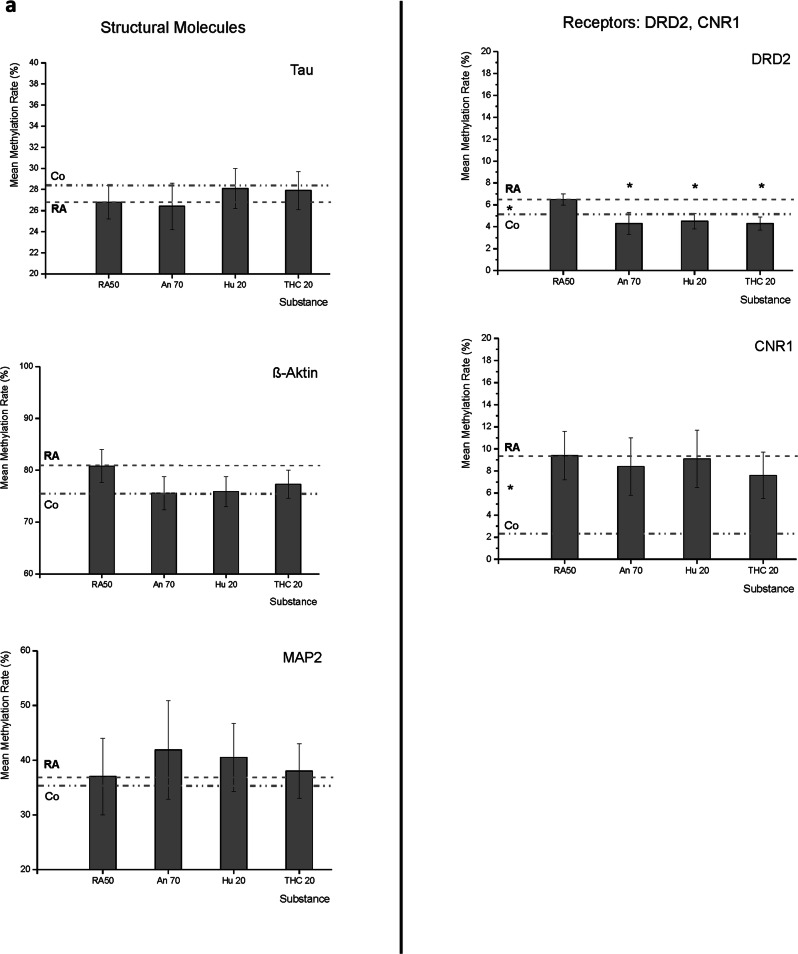
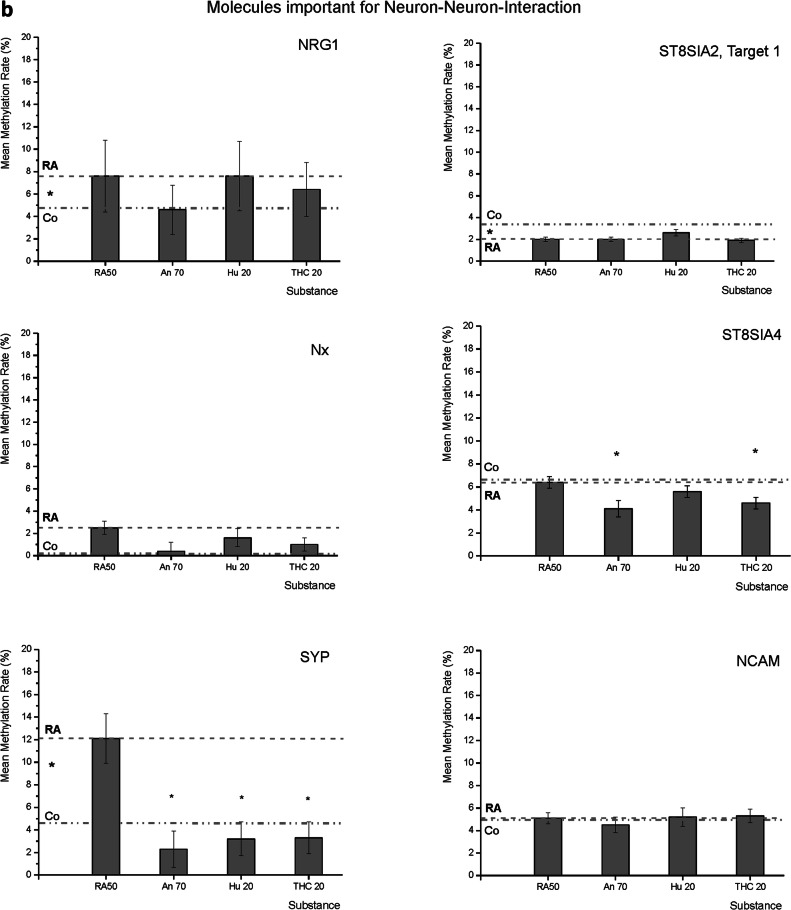
Fig. 2. Mean DNA-methylation rates of target molecules.
a Mean methylation rates of MAPT (Tau), ACTB (ß-actin), MAP2, DRD2, and CNR1 under the application of Retinoic Acid 50 µM (RA50) alone and in combination with either Anandamide (An70), HU210 (HU20) or tetrahydrocannabinol (THC20). For better subsumption of results, the broken line traces the RA50 level throughout the figure, and the dotted line represents the methylation rate of the respective target in undifferentiated control cells. Significant differences between controls and RA50-treated cells are indicated by * on the left between the two mentioned lines. In the case of DRD2, there were significant differences in methylation rates between differentiated cells and differentiated cells treated with Cannabinoids (indicated by * over the respective columns). In trend, cannabinoid treatment led to an approximation of methylation rates towards the level that was detected in untreated/undifferentiated control cells and also in the other investigated targets (besides MAP2). b Mean methylation rates of NRG1, NRXN1, SYP, ST8SIA2, ST8SIA4, and NCAM under application of retinoic acid 50 µM (RA50) alone and in combination with either Anandamide (An70), HU210 (HU20), or tetrahydrocannabinol (THC20). For better subsumption of results, the broken line traces the RA50 level throughout the figure, and the dotted line represents the methylation rate of the respective target in undifferentiated control cells. Significant differences between controls and RA50-treated cells are indicated by * on the left between the two mentioned lines. In the case of SYP, there were significant differences in methylation rates between differentiated cells and differentiated cells treated with Cannabinoids (indicated by * above the respective columns). In trend, cannabinoid treatment led to an approximation of methylation rates towards the level in untreated/undifferentiated control cells and also in the other investigated targets except for ST8SIA2 and 4.


