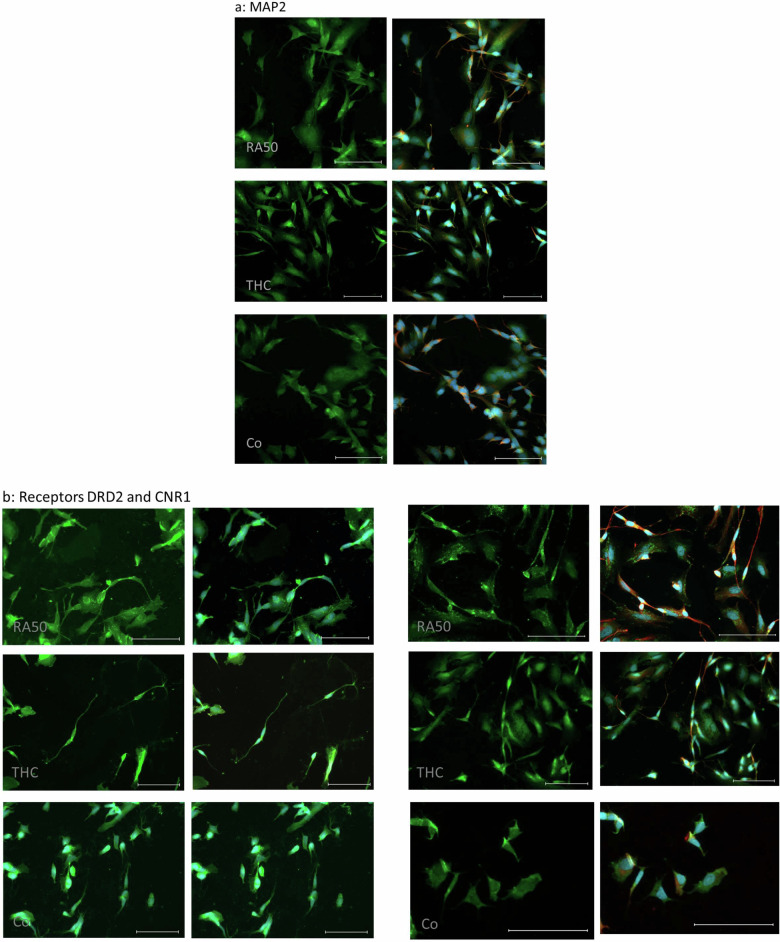
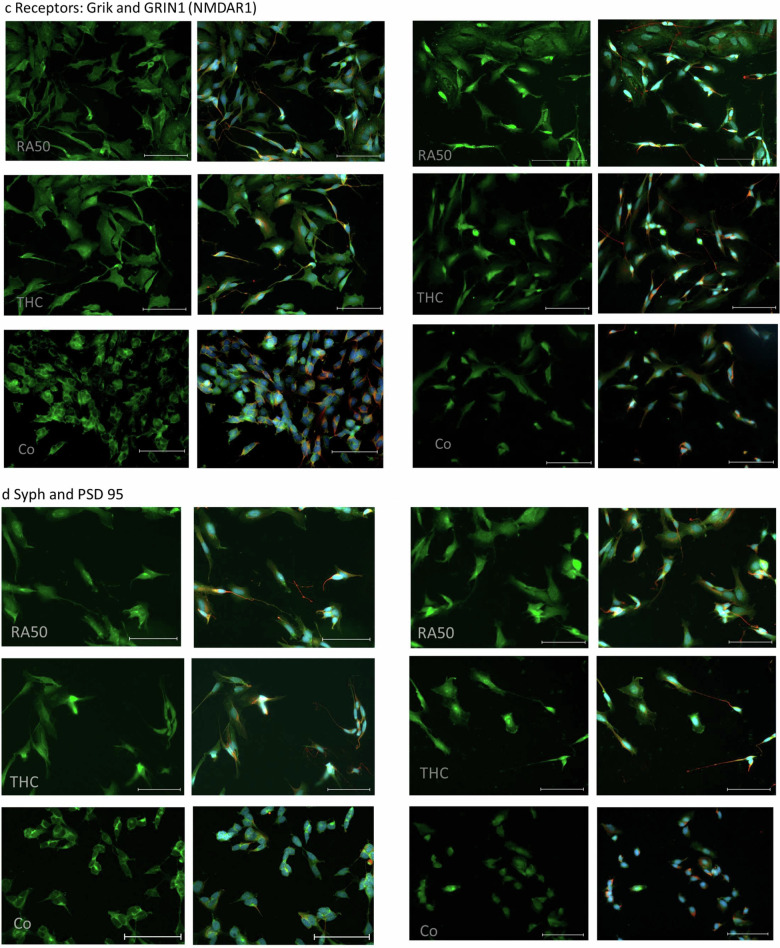
Fig. 4. ICC of target molecules.
a ICC of MAP2 in differentiated cells, THC-treated cells, and undifferentiated control cells. On the left side, sole MAP2-staining (green) is presented, whereas, on the right side, the corresponding merge pictures of the co-staining with TUBB3 (βIII-Tubulin) (red) and nuclei (blue) are depicted. The scale bar represents 100 µm. b ICC of DRD2 (left panel) and CNR1 (right panel) in differentiated cells, THC-treated cells and undifferentiated control cells. In the respective left column sole DRD2- and CNR1-, staining (green) is presented, whereas, in the right column, the corresponding merge pictures of the co-staining with TUBB3 (βIII-Tubulin) (red) and nuclei (blue) are depicted. Unfortunately, in the case of the DRD2 staining TUBB3 has not been stained for practical reasons. Scale bar: 100 µm. c ICC of Grik (left panel) and GRIN1 (NMDAR1) (right panel) in differentiated cells, THC-treated cells, and undifferentiated control cells. In the respective left column sole Grik- and GRIN-, respectively, staining (green) is presented, whereas, in the right column, the corresponding merge pictures of the co-staining with TUBB3 (βIII-Tubulin) (red) and nuclei (blue) is depicted. The scale bar represents 100 µm. d ICC of SYP (left panel) and DLG4 (PSD95) (right panel) in differentiated cells, THC-treated cells, and undifferentiated control cells. In the respective left column, sole SYP- and DLG4-staining (green) is presented, whereas, in the right column, the corresponding merge pictures of the co-staining with βIII-Tubulin (red) and nuclei (blue) is depicted. The Scale bar represents 100 µm.


