Fig. 7.
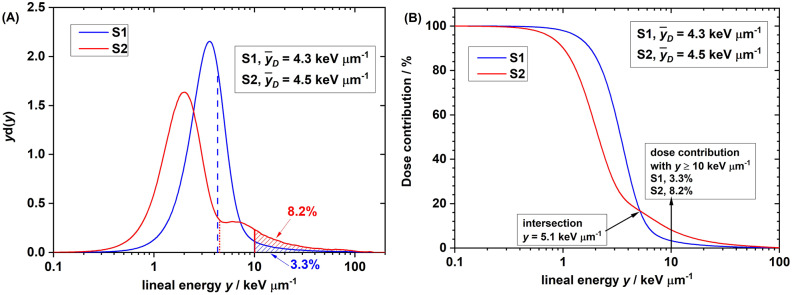
(A) Dose spectra of lineal energy y in proton setup S1 and S2. d(y) is the dose probability density of y. d(y) = yf(y), where f(y) is the frequency probability density of y. Note: lineal energy is scored on a log10 scale. Therefore, the product of y and d(y) is the differential dose contribution of the specified y. Data were normalized to make the entire area under curve equal to 1.0. (B) On the y-dose contribution histogram, the dose contribution accounts for the events with y ≥ the specified y, shown as the shaded area in (A). On the y-dose contribution histogram, the dose contribution from events with y ≥ 10 keV/µm was 8.2% for proton setup S1 and 3.3% for setup S2.

