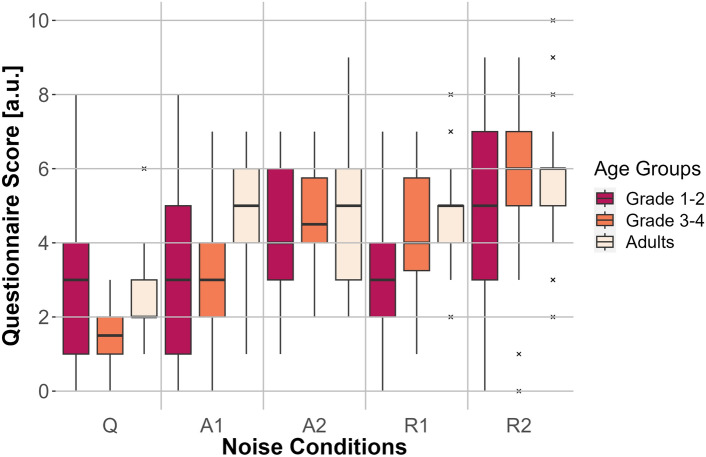
Fig. 7.
Questionnaire score for the three age groups (adults, first- to second-graders, and third- to fourth-graders) for the five noise conditions: no noise (Q), anechoic MTB with SNRs of 0 dB (A1) and −3 dB (A2) and MTB with room effects with SNRs of 0 dB (R1) and −3 dB (R2). The questionnaire score is depicted on the y-axis and the noise conditions are shown on the x-axis. Box plots show the median (middle line), and interquartile range of the data distributions.

