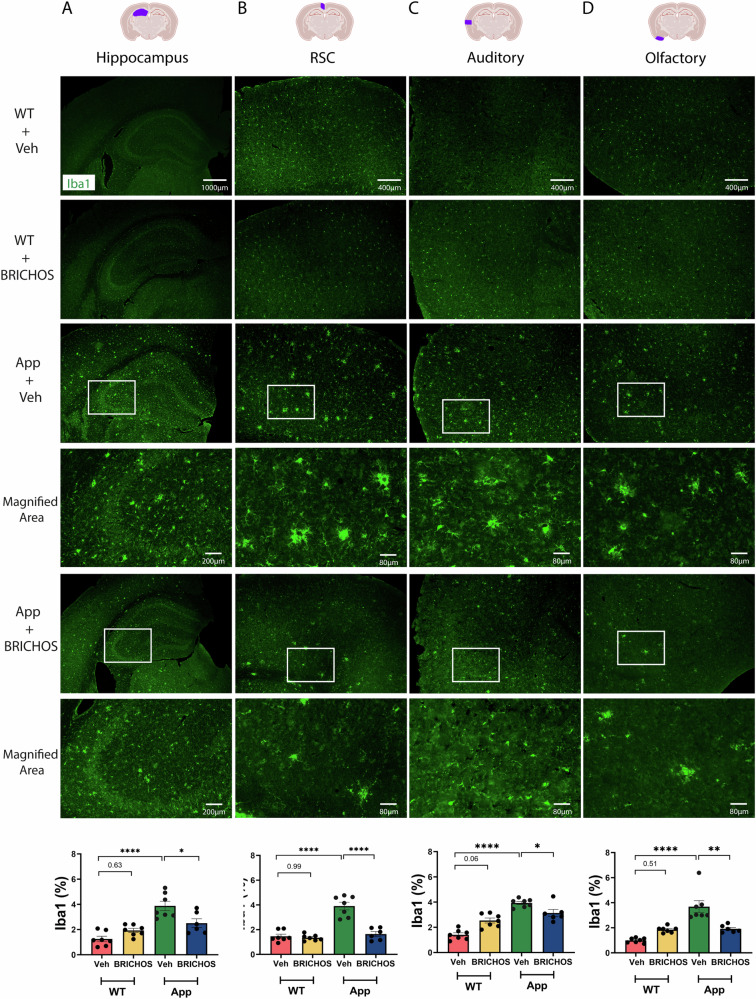
Fig. 4. Rh Bri2 BRICHOS R221E treatment mitigates microgliosis in AppNL-G-F mice.
Representative images of hippocampus (A) and cortex (B–D) sections from vehicle (veh)- and rh Bri2 BRICHOS R221E-treated AppNL-G-F (App) and WT mice stained by immunohistochemistry for Iba1. Bar charts at the bottom show the Iba1-positive area (%) in each brain region for the four treatment groups. The areas marked with boxes are magnified in the panels shown below them. All micrographs from the hippocampus are at a lower magnification than the micrographs from the cortex. Scale bars represent 1000 μm (A) and 400 μm (B–D) and apply to all panels in the respective column, except the magnified areas for which scale bars represent 200 μm (A) or 80 μm (B–D). Data are shown as mean ± SEM (n = 6–7 mice/group). One-way ANOVA test and Tukey’s test were used for statistical analysis. ∗p < 0.05, ∗∗p < 0.01, ∗∗∗∗p < 0.0001. The entire hippocampus was analysed. Iba1 ionized calcium-binding adaptor molecule 1, RSC retrosplenial cortex.

