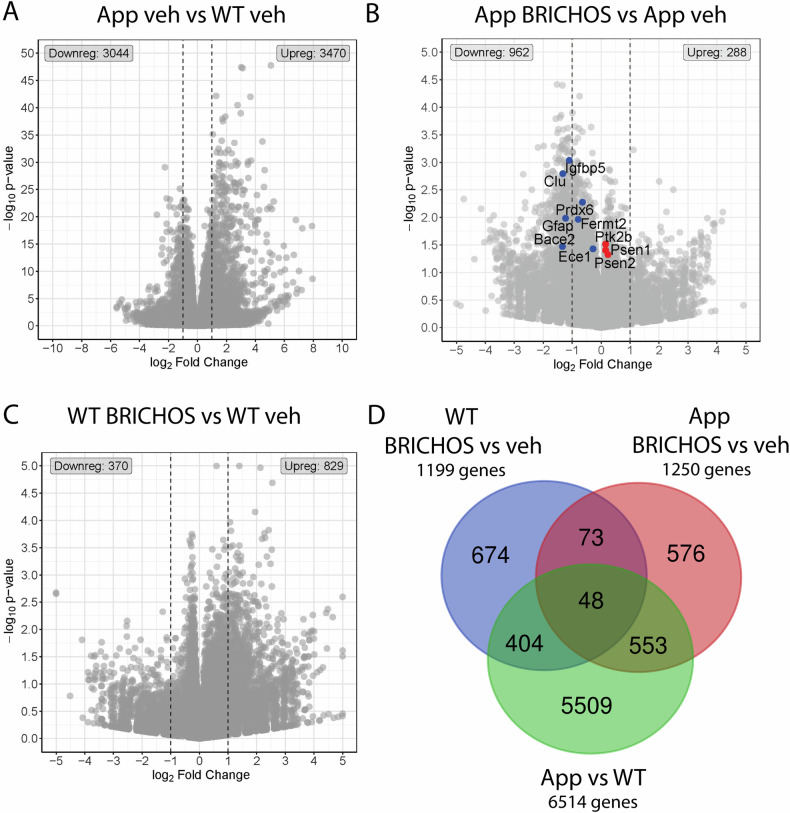
Fig. 6. Differentially expressed genes (DEGs) in microglia from AppNL-G-F and WT mice.
A–C Volcano plots showing DEGs between A vehicle (veh)-treated AppNL-G-F (App) and WT mice; B rh Bri2 BRICHOS R221E- and veh-treated AppNL-G-F mice, and C rh Bri2 BRICHOS R221E- and veh-treated WT mice. N = 3 mice/group. Different scales are used in panels (A–C) for optimal resolution of gene symbols. Vertical dotted lines indicate | log2fold change | ≥1 border. The ten genes identified in panel (B) are further analysed in Fig. 8. The number of down- or up-regulated genes is indicated for each panel. D Venn diagrams of DEGs in veh-treated WT and AppNL-G-F mice (green circle), veh- and rh Bri2 BRICHOS R221E-treated AppNL-G-F mice (red circle), and veh- and rh Bri2 BRICHOS R221E-treated WT mice (blue circle). The identities of the genes in the different intersections between the circles are given in the Supplementary Excel file 1.

