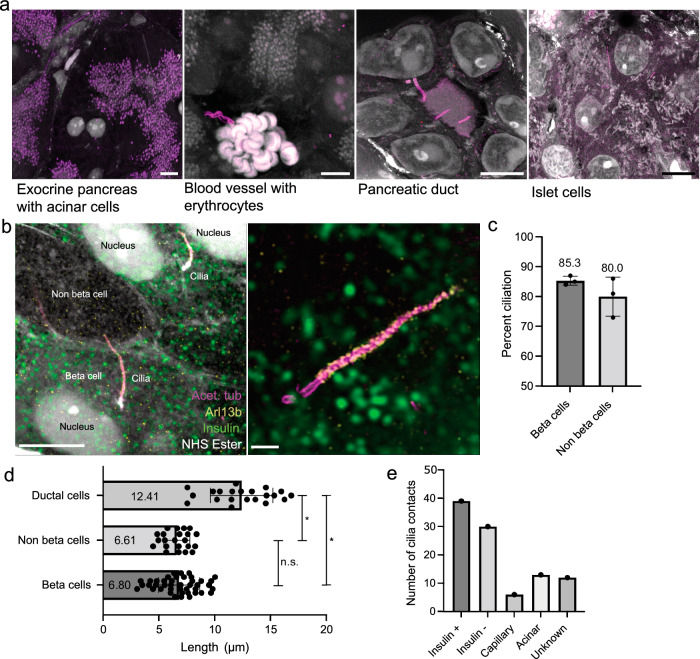
Fig. 4. U-ExM of mouse pancreas reveals cilia and cell type identity.
a Representative confocal images of expanded pancreatic tissues labeled with antibodies for acetylated tubulin (purple) and with NHS ester for total protein (white). Scale bars, 10 µm. b Higher-magnification images of ciliated islet cells, including beta cells, stained for insulin (green), acetylated tubulin (magenta), Arl13b (yellow), and NHS ester. Scale bar, left: 5 µm. Scale bar, right: 1 µm. c Quantification of percent ciliation in beta cells and non-beta cells within 3 islets from 3 different mice. 50 cells per islet were quantified. Mean ciliation percentage beta cells 85.3 % ± 1.528, non-beta cells, 80.0 % ± 6.557. Error is reported in standard deviation. d 3D length measurements of the cilium of ductal cilia, non-beta cells, and beta cells. Mean length: ductal cilia, 12.41 µm ± 2.8, non-beta cells 6.610 µm ± 1.158, beta cells 6.804 µm ± 1.841. Error is reported in standard deviation. Statistical significance is measured by unpaired, two-tailed, t-test. Ductal cells - beta cells: p = 1.11 × 10⁻¹³, ductal cells - non-beta cells: p = 3.44 × 10⁻¹¹, beta cells - non-beta cells: p = 0.6546. n = 42 beta cells, 22 non-beta cells, 21 ductal cells from 2 pancreata. e Number of contacts of beta cell cilia to beta- and non-beta islet cells, as well as endothelial, acinar cells, and unknown cells. Source data are provided as a Source Data file.

