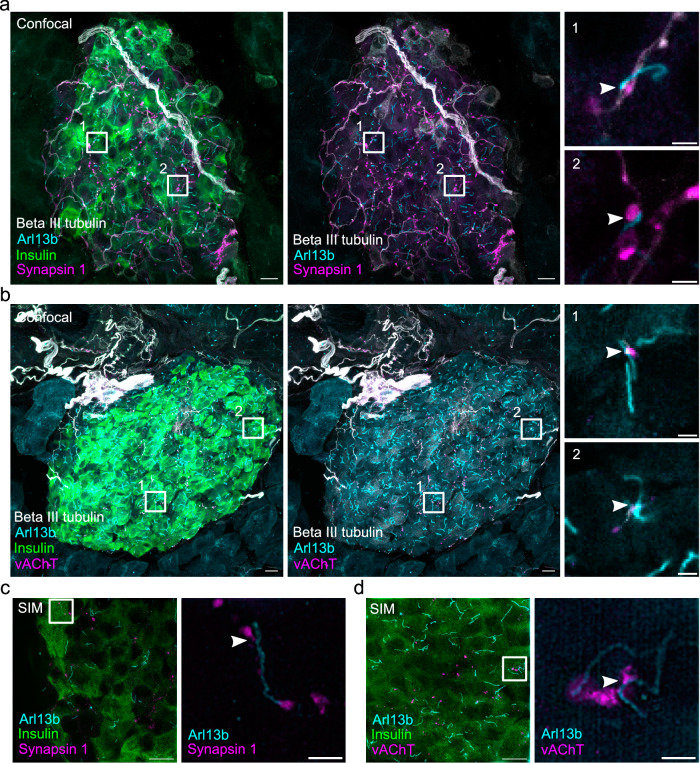
Fig. 9. Presence of synapsin 1 and vAChT at neuron-cilia contact sites.
a Maximum intensity confocal images of a cryo section of mouse pancreas after immunofluorescence labeling for insulin (green), beta III tubulin (white), Arl13b (cyan), and synapsin 1 (magenta). The center image shows the same region without the insulin. Scale bars: 10 µm. Regions 1 and 2 show Arl13b in close proximity to beta III tubulin and synapsin 1 and single confocal slices of these regions are magnified on the right. Scale bars: 2 µm. b Maximum intensity confocal images of a cryo section of mouse pancreas after immunofluorescence for insulin (green), beta III tubulin (white), Arl13b (cyan), and vAChT (magenta). The center image shows the same region without the insulin. Scale bars: 10 µm. Regions 1 and 2 show Arl13b in close proximity to beta III tubulin and vAChT and single confocal slices of these regions are magnified on the right. Scale bars: 2 µm. c Maximum intensity SIM images of a cryo section of mouse pancreas after immunofluorescence labeling for insulin (green), Arl13b (cyan), and synapsin 1 (magenta). Scale bar: 10 µm. The magnified box shows a single SIM slice with Synapsin 1 signal in close proximity to Arl13b. Scale bar: 2 µm. d SIM image of a cryo section of mouse pancreas after immunofluorescence labeling for insulin (green), Arl13b (cyan), vAChT (magenta). Scale bar: 10 µm. The magnified box shows a single SIM slice with vAChT signal in close proximity to Arl13b. Scale bar: 2 µm. Data were obtained from 2 mouse pancreata. Source data are provided as a Source Data file.

