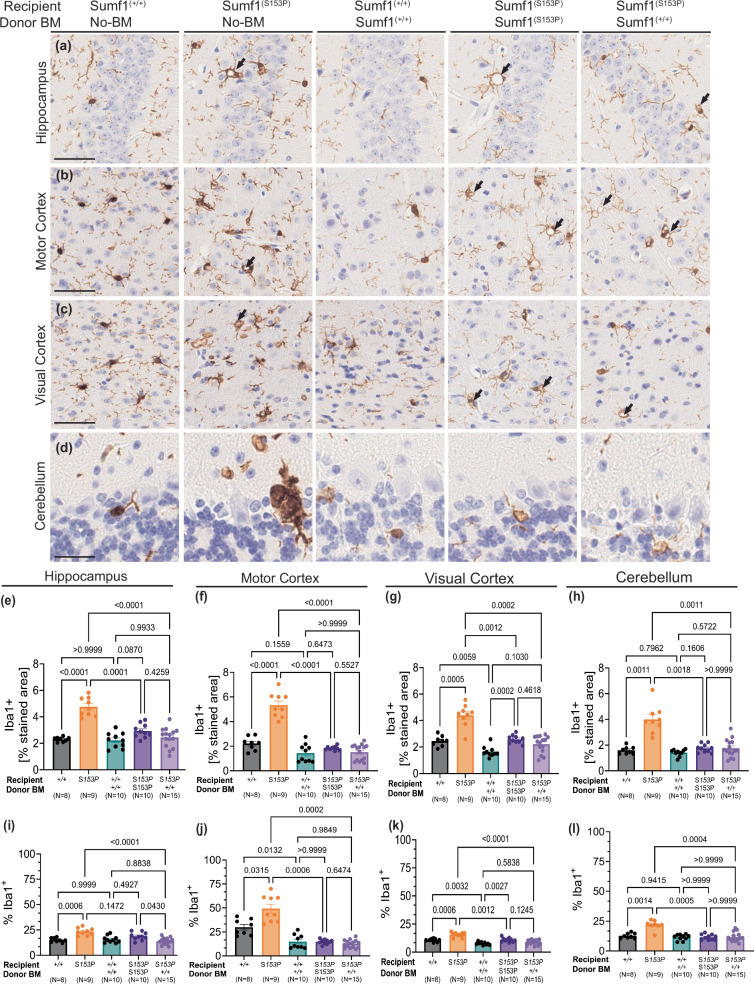
Fig. 4. Persistent microgliosis after HSCT.
Microglia assessed by Iba-1 immunohistochemistry on brain of Sumf1(+/+) no-BMT, Sumf1(S153P) no-BMT, recipient Sumf1(+/+) + BM-Sumf1(+/+), recipient Sumf1(S153P) + BM-Sumf1(S153P), and recipient Sumf1(S153P) + BM-Sumf1(+/+) at 10 months post-transplant. Representative images from hippocampus (a), motor cortex (b), visual cortex (c), and cerebellum (d). Microgliosis is represented as the percentage of stained area for Iba-1, and as percentage of Iba-1+ cells over total nucleated cells, in hippocampus (CA1) (e, i), motor cortex (f, j), visual cortex (g, k) and cerebellum (h, l) shown as bar graphs with mean ± SEM, dots represent individual mouse. Images (a–c) at x20 magnification, 50 μm scale bar. Images for cerebellum at x40, 25 μm scale bar. The black arrows point to vacuolated Iba-1+ cells. Multiple comparisons using Brown-Forsythe and Welch ANOVA tests. Exact P values are in Supplementary Data 1.

