Abstract
Disruption of the cell-cell junction with concomitant changes in the expression of junctional proteins is a hallmark of cancer cell invasion and metastasis. The role of adherent junction proteins has been studied extensively in cancer, but the roles of tight junction (TJ) proteins are less well understood. Claudins are recently identified members of the tetraspanin family of proteins, which are integral to the structure and function of TJs. Recent studies show changes in expression/cellular localization of claudins during tumorigenesis; however, a causal relationship between claudin expression/localization and cancer has not been established. Here, we report an increased expression of claudin-1 in human primary colon carcinoma and metastasis and in cell lines derived from primary and metastatic tumors. We also report frequent nuclear localization of claudin-1 in these samples. Genetic manipulations of claudin-1 expression in colon cancer cell lines induced changes in cellular phenotype, with structural and functional changes in markers of epithelial-mesenchymal transition. Furthermore, we demonstrate that changes in claudin-1 expression have significant effects on growth of xenografted tumors and metastasis in athymic mice. We further provide data suggesting that the regulation of E-cadherin expression and β-catenin/Tcf signaling is a possible mechanism underlying claudin-1–dependent changes.
Introduction
Cell-cell adhesion in epithelial cell sheets is maintained mainly through adherens junctions (AJs) and tight junctions (TJs). AJs have been a major focus of cancer studies, and expression and/or integrity of several AJ components, catenins (α, β, γ, and E-cadherin in particular, are altered or dysregulated in various carcinomas (1–4). Activation of the Wnt signaling cascade, due either to inactivating mutations in the adenomatous polyposis coli (APC) or activating mutations in the gene encoding β-catenin, is observed in the majority of colorectal cancers (5–9).
In contrast to the roles of AJs proteins, the role of TJ proteins in cancer is less well understood. TJs are the most apical cell-cell contacts and are important for barrier function in epithelial and endothelial cells (10, 11). A number of integral membrane proteins associated with the TJ have been identified during recent years, including occludin (12), junctional adhesion molecule (13), and the claudin family consisting of at least 24 members (14). Tumor cells, particularly in those cancers that manifest high metastatic potential, often exhibit loss of functional TJs. For example, levels of zona occludens 1 (ZO-1), ZO-2, and occludin are decreased during tumor formation and metastasis (15, 16).
The role of claudins in cancer has not been clearly defined. For instance, while claudin-7 has been found to be decreased in invasive ductal carcinomas of the breast (17), levels of claudin-3 and -4 are frequently elevated in various cancers, including pancreatic adenocarcinoma and ovarian cancer (18, 19). Claudins encode proteins with 4 transmembrane domains, and their N- and C-terminal ends are located in the cytoplasm. Claudin family members interact with each other through homo- and heterophilic interactions. In addition, the C-terminal domain of claudins also serves as a binding site for interaction with a complex set of proteins including a number of PDZ domain proteins — ZO-1, ZO-2, ZO-3, multi-PDZ domain protein 1 (MUPP1) — that are potentially involved in signaling (20, 21). Furthermore, stimulation by growth factors (EGF and TGF-β) regulates the expression of various claudins, but the significance of this regulation is as yet unclear (22, 23). It is of interest that claudin-1, -2, -3, and -5 have been reported to recruit and promote the activation of pro–MMP-2 (24, 25), which suggests potential involvement in invasion and metastasis. Claudin-1 was also recently identified as a probable target of β-catenin/Tcf signaling, which supports a potential role for claudin-1 dysregulation in colorectal carcinogenesis (26). Based on these studies, we hypothesized that claudins have a causal role in the process of cellular transformation and invasion.
In the present study, we report increased expression of claudin-1 in human colon cancers, with mislocalization from the cell membrane to the cell nucleus and cytoplasm. Metastatic colon cancer cells expressed the highest levels of claudin-1 and exhibited the highest rate of cellular mislocalization. Using genetically manipulated colorectal cancer cells as tools for in vitro and xenograft tumor models, we demonstrate a role for claudin-1 in the regulation of cellular transformation, tumor growth, and metastasis.
Results
Claudin-1 expression increases with the progression of colon carcinoma and metastasis.
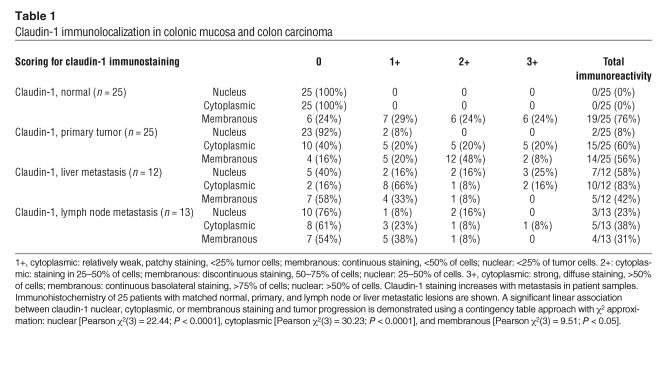
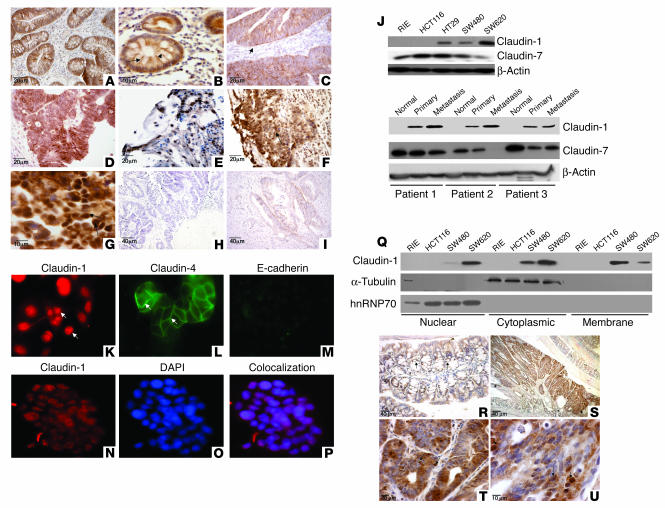
Paraffin-embedded sections of normal, primary, and metastatic human tumor specimens from 25 individual patients were examined for claudin-1 immunoreactivity. In contrast to normal colonic mucosa, where the staining was restricted to the cell membrane and stained laterally rather than apically, colon carcinomas and metastatic lesions showed enhanced and nonjunctional claudin-1 staining, localized largely in the nucleus and cytoplasm (Table 1 and Figure 1, A–I). In addition to being mislocalized, claudin-1 immunoreactivity was consistently more intense and present in a higher percentage of cells from primary colon adenocarcinoma and further from metastatic lesions than normal colon epithelial cells (P < 0.0001, for cytoplasmic and nuclear staining). Interestingly, nuclear staining of claudin-1 was observed in 58% of liver metastases (7/12) and in 35% of lymph node metastases (3/13) but not in normal colonic epithelial cells (0/25).
Table 1.
Claudin-1 immunolocalization in colonic mucosa and colon carcinoma
Figure 1.
Claudin-1 expression increases in colon carcinoma and metastasis. (A–I) Paraffin-embedded sections of matched normal, colonic tumor, and metastatic tissues samples from the same patients were examined for claudin-1 expression and subcellular localization by immunohistochemistry using a polyclonal rabbit anti–claudin-1 antibody. (A and B) Representative normal colon tissue. Arrows indicate membranous staining. (C–E) Primary human colon adenocarcinoma tissues. Claudin-1 immunoreactivity was visible in the cytoplasm and cell nucleus (arrows). (F and G) Colon adenocarcinoma metastatic to the liver. Claudin-1 nuclear localization is shown by the arrows. (H) Tumor showing no immunoreactivity for claudin-1. (I) No staining was observed in a control experiment without primary antibody. (J) Claudin-1 expression in cell lines and human tissue samples. Equal amounts of total protein (25 μg) from various cell lines (upper panel) or tissues extracts (matched normal primary and metastasis samples; lower panel) were immunoblotted with claudin-1, claudin-7, or actin antibody. (K–P) Immunofluorescence localization of claudin-1, claudin-4, and E-cadherin in metastatic SW620 cells. (K–M) Claudin-1 (red) was predominantly localized in cell nucleus (arrows), whereas claudin-4 was largely localized on cell membrane (green; arrows). (N–P) Colocalization of claudin-1 (red) with DAPI (blue) is confirmed by overlay (purple). (Q) Cytoplasmic, nuclear, and membrane-specific fractions were prepared as described in Methods. Equal amounts of protein from all fractions were subjected to Western blot analysis using claudin-1 antibody. (R–U) Claudin-1 expression in intestinal epithelium and adenoma in ApcMin/+ mice. By immunohistochemical analysis, claudin-1 is detected in the mucosa primarily in the membrane (arrows) and in the adenoma mainly in the cytoplasm and nucleus (S–U) in ApcMin/+ mice.
Immunoblotting was performed using total cell lysates from colon cancer cell lines, including HCT116, HT29, SW480, and SW620, and from human tissues (matched normal mucosa, primary colon carcinoma, and liver metastasis samples from 3 patients) using claudin-1–specific antibody (Figure 1J, upper panel). Nontransformed rat intestinal epithelial (RIE) cells were included as an example of noncancerous intestinal epithelial cells. Claudin-1 was undetectable in the RIE cells and YAMC cells (an immortalized but nontransformed mouse colonocyte cell line; data not shown). In contrast, claudin 1 was expressed in SW480, HT29, and SW620 cells, with the highest expression in the metastatic colon cancer cell line SW620. Interestingly, each of these 3 cell lines carries an APC mutation, while RIE and HCT116 express wild-type APC. However, the HCT116 cells express a mutant, activated form of β-catenin.
The level of claudin-1 expression was also higher in primary human colon tumor lysates and lysates from metastatic lesions than in adjacent normal tissue (Figure 1J, lower panel). Semiquantitative RT-PCR analysis of claudin-1 mRNA expression further supported this observation, showing 1.4-fold higher expression of claudin-1 in SW620 cells compared with HT29 and SW480 cells (Supplemental Figure 1; supplemental material available online with this article; doi:10.1172/JCI24543DS1). No mRNA expression for claudin-1 was detected in RIE or HCT116 cells, which also supports the data from the immunoblot analysis (Figure 1J, upper panel). Another claudin isoform, claudin-7, was expressed in the RIE cells, and it was expressed less abundantly in colon cancer tissue lysates and cell lines than was claudin-1.
Immunofluorescence studies using SW620 cells showed that claudin-1 was localized predominantly in the cell nucleus and in the cytoplasm, in contrast to claudin-4, which was predominantly localized on membrane (Figure 1, K–M). As expected, SW620 metastatic cells expressed low levels of E-cadherin. Immunofluorescence colocalization studies with the nuclear-specific marker DAPI along with claudin-1 antibody confirmed that claudin-1 was predominantly localized in the nucleus in SW620 cells (Figure 1, N–P).
To confirm our observations from immunofluorescence studies, we prepared cytoplasmic, nuclear, and membrane-specific fractions as described in Methods and immunoblotted them with an anti–claudin-1 antibody. The nuclear and cytoplasmic expression of claudin-1 was greater in SW620 cells than in SW480 cells, with a concomitant decrease in the membrane fraction. No claudin-1 expression was detected in RIE or HCT116 cells in either the cytoplasmic or nuclear-specific fractions (Figure 1Q). To ensure that the observed nuclear signal of claudin-1 was not simply a contamination from cytoplasmic extracts and vice versa, we stripped these blots and reprobed them with α-tubulin (cytoplasmic marker) or hnRNP70 (nuclear marker). No α-tubulin expression was detected in nuclear fractions, and no hnRNP70 expression was detected in cytoplasmic fractions or in membrane fractions, even at prolonged exposures, which confirmed the specificity of the cellular fractions.
It was interesting that all the colon cancer cell lines with increased expression of claudin-1 are known to carry an APC mutation, a well-known initiating factor of carcinogenesis in the colon. Therefore, to confirm that claudin-1 is indeed a target of the APC/β-catenin pathway in vivo, we performed immunohistochemical analysis for claudin-1 in adenomas from ApcMin/+ mice. In results supporting our hypothesis, claudin-1 protein levels were not only highly elevated, but expression was predominantly mislocalized from the membrane to the nucleus and cytoplasm in the intestinal adenomas of ApcMin/+ mice (Figure 1, S–U). In the normal-appearing adjacent intestinal epithelium of the ApcMin/+ mice, the claudin-1 immunoreactivity was detected exclusively in cell membrane and a small portion in the cytoplasm (Figure 1R). The adenomas of Min mice express mutant APC due to somatic inactivation of the second allele, while normal intestinal epithelium of heterozygous ApcMin/+ mice usually expresses wild-type APC protein (27). This observation further supports the notion that nuclear and cytoplasmic localization of claudin-1 is a common event in colorectal tumorigenesis and is associated with loss of APC tumor suppressor function with activation of nuclear β-catenin.
Claudin-1 is important for tumorigenesis and invasive properties of colonic epithelial cells.
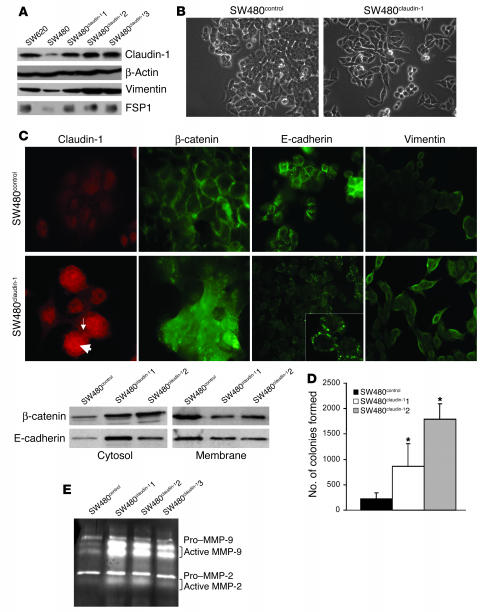
To determine whether claudin-1 protein expression has a causal role in tumor progression and invasion, we manipulated the expression levels of claudin-1 expression in SW480 and SW620 cell lines. These cell lines were chosen because they are derived from primary (SW480) and metastatic lesions (SW620) of a single colon cancer patient (28). Since SW480 cells express lower levels of claudin-1 than do SW620 cells, we overexpressed claudin-1 in SW480 cells to achieve claudin-1 levels comparable to the level in SW620 cells. Three such SW480 clones were selected: SW480claudin-11, -2, and -3 (Figure 2A). The SW480claudin-1 cell morphology appeared spindly and fibroblastoid in monolayer culture, whereas the SW480control showed epithelioid spreading similar to that of parental cells (Figure 2B). Expression of mesenchymal markers vimentin and fibroblast-specific protein–1 (FSP1) (29) and the epithelial marker, E-cadherin, was examined by Western blot and by immunofluorescence analyses. Increased expression of vimentin and FSP1 was observed in SW480claudin-1 cells compared with the SW480control cells (Figure 2, A and C). The steady-state levels of E-cadherin were not significantly altered (data not shown); however, the localization of E-cadherin was altered in the SW480claudin-1 cells, where we observed it in the cytoplasm and in clustered locations at the cell membrane; in contrast, in SW480control cells, membrane staining was typically diffuse (Figure 2C). β-Catenin was primarily localized at the cell membrane in SW480control cells but was largely cytosolic in the SW480claudin-1 cells (Figure 2C). In addition, the SW480claudin-1 cells formed significantly more colonies in soft agarose than did control cells, which indicates enhanced anchorage independence (Figure 2D). Claudin-1 is known to affect MMP activation (25); therefore, we determined whether there were any changes in MMP activation in SW480claudin-1 cells. Interestingly, gelatin zymography revealed an increase in MMP-2 and MMP-9 activity in SW480claudin-1 clones compared with the control cells (Figure 2E).
Figure 2.
Overexpression of claudin-1 in the primary colon adenocarcinoma cell line SW480 cells induces further dedifferentiation. (A) Immunoblot analysis for the expression of claudin-1, vimentin, and FSP1 in SW620, SW480control, and SW480claudin-1 cells. The expression of these proteins was similar in SW480 and SW480control cells. Actin was used as a control for protein loading. (B) Representative phase-contrast images of SW480control and SW480claudin-1 cells growing in monolayer cultures. (C) The upper panel represents immunofluorescence localization of claudin-1, E-cadherin, β−catenin, and vimentin in SW480control or SW480claudin-1 cells. Arrows show the nuclear (thick arrow) and membrane (thin arrow) expression of overexpressed claudin-1. The lower panel represents the cytosol and membrane localization of β-catenin and E-cadherin in SW480control and SW480claudin-1 cells. (D) Results of soft agar assay. Colonies were counted from 3 individual plates for each sample, and SW480claudin-1 or SW480control cells were photographed 2 weeks after plating. The number of soft agar colonies presented is the mean of colony counts from 3 different experiments. *P < 0.05 compared to control. (E) Gelatin zymography for determination of MMP-2 and MMP-9 activity. Experiments were performed as described in Methods. MMP-2 and MMP-9 activity was increased in SW480claudin-1 cells compared with SW480control cells.
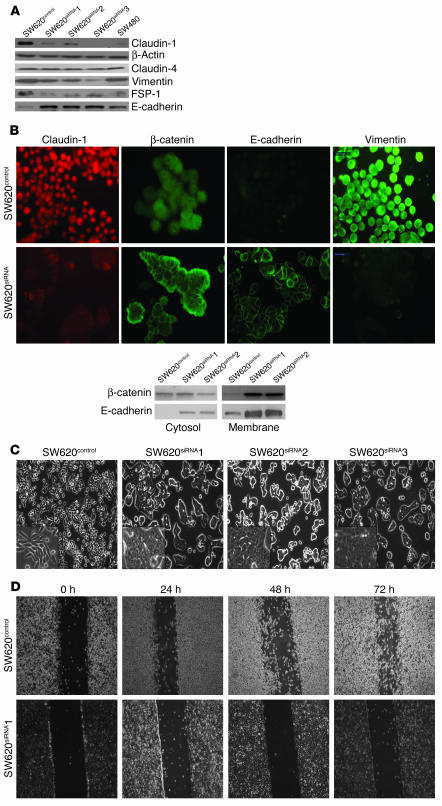
In experiments complementary to the overexpression studies, we used small interfering RNA (siRNA) oligonucleotide–based inhibition of gene expression to show that expression of claudin-1 was inhibited in the metastatic SW620 cells. Three human claudin-1–specific siRNA oligonucleotides were utilized for the transient transfection experiments. The most effective siRNA claudin-1 oligonucleotide was then selected, subcloned into the pRNA vector, and stably transfected into SW620 cells as described in Methods. Three clones, SW620siRNA1, -2, and -3, exhibiting 80–90% inhibition of claudin-1 protein expression as determined by Western blot analysis, were selected for further study. No apparent change in claudin-1 protein expression was observed in SW620control cells. Also, expression of claudin-4 was not affected in the SW620siRNA cells, which validated the specificity of the siRNA (Figure 3A).
Figure 3.
Effects of siRNA-based inhibition of claudin-1 expression in the metastatic SW620 cells. (A) Western blot analysis of SW620 cells stably expressing claudin-1 siRNA (SW620siRNA). Equal amounts of total protein were subjected to immunoblot analysis using anti–claudin-1 antibody. The clones shown were selected based on similar levels of inhibition of claudin-1 expressions. The same lysates were also subjected to immunoblot analysis for claudin-4 to determine the specificity of the siRNA oligonucleotide. Immunoblotting for vimentin, FSP1, and E-cadherin was performed using the same lysates. (B) The upper panel represents immunofluorescence localization of claudin-1, β-catenin, E-cadherin, and vimentin in SW620siRNA cells. Only SW620control cells are shown, as there were no visible differences between SW620control cells and parental SW620 cells. The lower panel represents results of immunoblot analysis using cytosolic and membrane-specific fractions for expressions of β-catenin and E-cadherin in SW620control and SW620siRNA cells. (C) Representative phase-contrast images of monolayer cultures of SW620control, and SW620siRNA cells. (D) Representative photomicrographs of cell migration by monolayer wound-healing assay using SW620control and SW620siRNA clones. Photomicrographs were obtained 0, 24, 48, and 72 hours after standard scrape wounding, as described in Methods.
Western blot and immunofluorescence analyses indicated a decrease in the expression of mesenchymal markers such as vimentin and FSP1 but a robust increase in E-cadherin expression (Figure 3, A and B) in all 3 SW620siRNA clones compared with control cells. Immunofluorescence studies revealed a honeycomb pattern of E-cadherin at sites of cell-cell contact in all SW620siRNA clones. In addition, localization of β-catenin increased in the membrane of SW620siRNA cells as compared to cytoplasmic and nuclear localization in parental or control cells (Figure 3B and Supplemental Figure 2). Parental and SW620control cells exhibited round, elongated, and dispersed morphology, whereas SW620siRNA cells exhibited a spreading, epithelial appearance and tended to form multicellular aggregates (Figure 3C). A monolayer wound-healing assay revealed almost no migration in SW620siRNA cells compared with SW620control cells (Figure 3D). The 3 clones of the SW620siRNA cells performed identically in this assay (data not shown for clones 2 and 3).
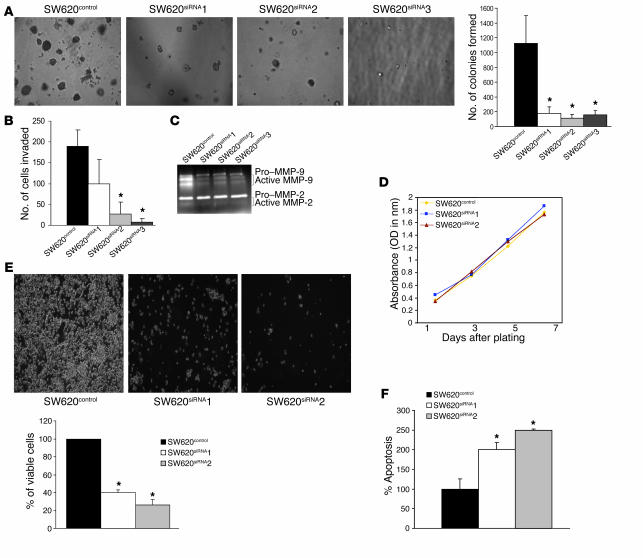
Furthermore, in contrast to the results for SW480 cells overexpressing claudin-1, SW620siRNA cells demonstrated a significant decrease in both the number and size of colonies formed compared with SW620control cells when cultured in soft agarose (P < 0.05; Figure 4A). In addition, using a Boyden chamber invasion assay, we observed a significant decrease in the invasive capacity of SW620siRNA cells (Figure 4B). A gelatin zymogram for MMP activation demonstrated a decrease in MMP-9 activity in SW620siRNA compared with SW620control cells (Figure 4C). However, we did not observe a significant decrease in MMP-2 activity.
Figure 4.
Effects of siRNA-based inhibition of claudin-1 expression in SW620 cells on proliferation, anchorage-independent growth, and invasion. (A) Results of soft agar assay. Experiments were performed as described in Methods. The number of soft agar colonies presented is the mean of colony counts from 3 different experiments. (B) A cell invasion assay was performed using 24-well transwells coated with collagen type I (100 μg/ml). After 72 hours of plating, cells from the top of the filter were removed, and the cells that invaded the coated membrane were fixed and counted. Data are presented as mean colony counts in ten ×20 microscopic fields from duplicate wells. *P < 0.05, as compared to control. (C) Gelatin zymography to determine the activities of MMP-2 and MMP-9 in SW620control cells and in all 3 SW620siRNA clones was performed as described in the Methods. (D) Cellular proliferation was measured in SW620control and SW620siRNA cells using MTT assay at 1, 3, 5, and 7 days after plating equal number of cells. (E) The anoikis assay was performed by plating the SW620control and SW620siRNA cells on polyHEMA-coated culture dishes for 72 hours as described in Methods. Values for control cells were considered 100%, and any differences are expressed relative to that value. Each bar represents the mean ± SD of 3 experiments. (F) The anoikis-induced apoptosis was quantitated using apoptosis-specific ELISA. Values for control cells were considered 100%, and any changes were compared with that value. Each bar represents the mean ± SD of 3 experiments.
Given the importance of induction of proliferation and/or inhibition of apoptosis in the regulation of neoplastic transformation, we investigated the effect of inhibition of claudin-1 in SW620 cells on the rate of cellular proliferation. Manual cell counting every 48 hours over a period of 7 days (on days 1, 3, 5, and 7) following plating of equal numbers of cells (data not shown) or tetrazolium salt (MTT) assay (Figure 4D) did not reveal any significant difference in cellular proliferation due to inhibition of claudin-1 expression. Anoikis (apoptosis resulting from loss of cell matrix interaction) is an established model for determining cell survival independent of cell attachment; therefore, we next determined the effect of inhibition of claudin-1 on anoikis. Interestingly, inhibition of claudin-1 in SW620 cells resulted in significant cell death due to anoikis (Figure 4E). To further confirm that the cell death is due to anoikis (detachment leading to programmed cell death), we performed an ELISA-based, apoptosis-specific assay. As shown in Figure 4F, inhibition of claudin-1 expression significantly increased apoptosis due to anoikis. In contrast, SW480claudin-1 cells were more resistant than SW480control cells to anoikis (data not shown).
Taken together, the above data strongly suggest that claudin-1 plays an important role in the regulation of cellular transformation and thus potentially contributes to the phenotype of invasion and metastasis.
In vivo assessment of tumor growth and metastatic potential.
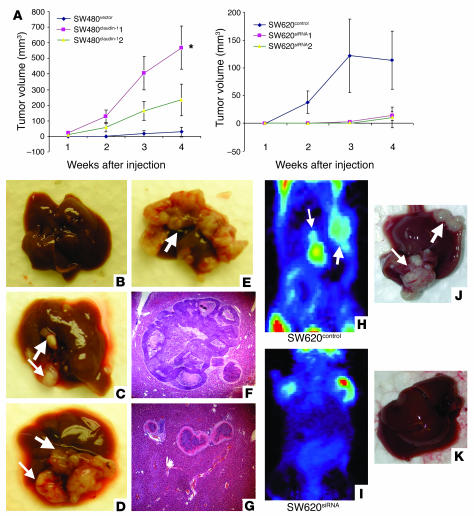
Based on our cell culture data, we postulated that claudin-1 expression would affect tumor formation and metastasis in vivo. Cells from each group (SW480control and 2 independent clones of SW480claudin-1 or SW620 parental, SW620control, and 2 independent clones of SW620siRNA cells) were injected subcutaneously into the flanks of nude mice (n = 5 for each group). In mice injected with the 2 clones of SW480claudin-1 cells, measurable tumors appeared within 1 week and grew to an average volume of 233 and 500 mm3, respectively, by 4 weeks after injection. In contrast, tumors from mice injected with SW480control cells became detectable only after 3 weeks of growth, and the average tumor volume was only 25 mm3 at 4 weeks after injection. Furthermore, the incidence of tumor formation following subcutaneous injections was only 20% in mice injected with SW480 cells compared with 80% in mice receiving claudin-1–overexpressing SW480-derived clones. Conversely, SW620 parental and SW620control cells started developing tumors at 1–2 weeks after injection, and the average tumor volume was 106 and 114 mm3, respectively, after 4 weeks of growth, while the 2 clones of SW620siRNA cells had average volumes of 11 and 14.8 mm3, respectively, after the same period of time (Figure 5A).
Figure 5.
Effect of modulation of claudin-1 expression on tumor xenograft and liver metastasis in vivo. (A) Flank tumor xenografts after subcutaneous injection (n = 5 mice per group) were monitored for SW480control or 2 individual SW480claudin-1 clones in nude mice (*P < 0.005 and P = 0.063 for each clone compared with the control group). Conversely, cells expressing either SW620control or 2 individual SW620siRNA clones in nude mice were used (P = 0.27 and P = 0.26). The P value was determined using unpaired Student’s t test. (B–G) Liver metastasis. Representative metastatic tumors in livers from SW480control (B) and SW480claudin-1 cells (C–E) from experiments on nude mice, with corresponding H&E sections indicating intrahepatic tumors (F and G), are shown. (F) Microscopic examination of the liver tumors confirmed that they represented metastases. (G) Intrahepatic vascular spread was noted. (H–K) SW620 parental or SW620control cells or 3 individual SW620siRNA clones were injected in nude mice. Seven weeks after inoculation, metastatic tumors were detected in the livers of nude mice by microPET (H and I) and upon necroscopy (J and K). MicroPET imaging was used to screen for nonpalpable lesions in the liver, using 100–150 μCi of 18F-deoxyglucose (18FDG) injected i.p to detect metabolically active foci in the abdomen. The arrows point to the metastatic nodules in the liver. The P value was determined using 2-sided test of proportion.
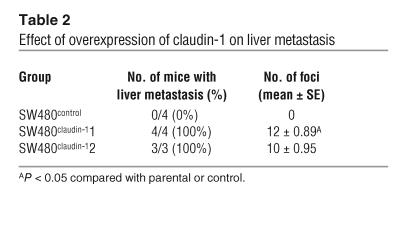
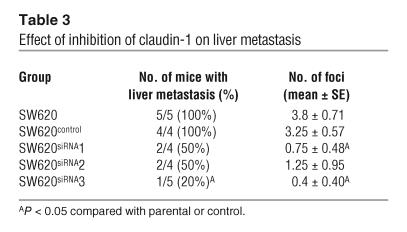
In order to determine the impact of claudin-1 expression on metastatic potential, we injected nude mice intrasplenically with either SW480control or SW480claudin-1 cells or, alternatively, with SW620 parental, SW620control, or SW620siRNA cells. We screened mice for liver lesions using microPET imaging starting at 4 weeks after splenic injection, and thereafter screening was repeated weekly. After 4 weeks, mice inoculated with SW480control cells had 0% incidence of liver metastasis (n = 4; Figure 5B), while the 2 SW480 clones overexpressing claudin-1 had 100% incidence of liver metastasis (n = 4 and 3, respectively; Figure 5, C–E). Large tumor foci on the liver surface were observed in livers of mice injected with SW480claudin-1 cells, while there were none in the control group (Table 2). Furthermore, histological examination of liver sections from left lobes of each liver confirmed intrahepatic metastatic tumors only in mice injected with SW480claudin-1 cells (Figure 5, F and G). On the other hand, at 7 weeks after injection, microPET imaging indicated metabolically active abdominal foci in several mice inoculated with SW620 cells (Figure 5, H and I). All of the mice were then euthanized and subjected to autopsy, and surface liver metastases were assessed (Figure 5, J and K). Incidence of liver metastases was detectable in 5 of 5 and 4 of 4 (100%) of parental SW620 and SW620control groups, respectively, whereas 2 of 4, 2 of 4, and 1 of 5 mice from the 3 SW620siRNA clones, respectively, had detectable liver metastases. Furthermore, the number of surface tumor foci in livers of mice injected with SW620siRNA cells was significantly reduced compared with that in the control group (Table 3).
Table 2.
Effect of overexpression of claudin-1 on liver metastasis
Table 3.
Effect of inhibition of claudin-1 on liver metastasis
Claudin-1 regulates E-cadherin expression.
We observed that inhibition of claudin-1 expression in SW620 cells increases E-cadherin expression. To determine whether claudin-1 regulates E-cadherin protein or mRNA expression, we prepared total RNA from parental, SW620control, and SW620siRNA cells and subjected it to semiquantitative RT-PCR analysis as described in Methods.
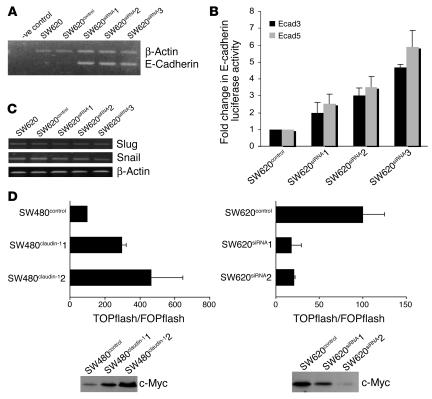
We found that claudin-1 inhibition increased E-cadherin mRNA expression in all 3 clones compared with parental and control transfected cells (Figure 6A). To further determine whether inhibition of claudin-1 expression alters E-cadherin promoter activity, we performed luciferase reporter assays using E-cadherin promoter elements Ecad3/Luc and Ecad5/Luc (containing 1,484 and 493 bp, respectively). Reporter gene constructs containing as few as 493 bp of E-cadherin proximal promoter sequence exhibited a 2.5- to 6-fold increase in E-cadherin promoter activity in SW620siRNA cells compared with control transfected cells (Figure 6B).
Figure 6.
Effect of inhibition of claudin-1 on E-cadherin expression and β-catenin/Tcf/Lef activity. (A) Endogenous levels of E-cadherin mRNA were measured by semiquantitative RT-PCR using total RNA from SW620 parental or SW620control cells or 3 individual clones of SW620siRNA cells as described in Methods. Primers for actin were used as internal control in the same reaction. -ve control, without reverse transcriptase. (B) The luciferase reporter activity under the control of human E-cadherin promoter construct was measured in the SW620control and SW620siRNA cells. Each bar represents the mean ± SD of 3 experiments. (C) The endogenous levels of Snail and Slug mRNA measured by semiquantitative RT-PCR using RNA from SW620 parental, SW620control, and SW620siRNA cells. Primers for actin were used as a control. (D) SW480control and SW480claudin-1 or SW620control and SW620siRNA cells were transiently cotransfected with TOPflash or FOPflash reporter constructs and SV40–β-galactosidase as internal control (upper panel). Tcf-mediated gene transcription was determined by the ratio of pTOPflash to pFOPflash luciferase activity. Transfections were done in triplicate, and each bar represents the mean ± SD of 3 experiments. Immunoblot analysis of c-Myc in SW480claudin-1 and SW620siRNA cells compared with their respective control cells (lower panel).
To further explore the mechanism of increased E-cadherin transcription, we examined the mRNA expression of Snail and Slug, which are known to be involved in transcriptional repression of the E-cadherin gene (30–32). Interestingly, mRNA expression levels of Snail or Slug were not affected in SW620siRNA cells compared with parental or control cells (Figure 6C).
Inhibition of claudin-1 in SW620 metastatic cells leads to a reduction inβ-catenin/Tcf/Lef signaling.
Previous studies using SW480 colorectal cancer cells demonstrated that E-cadherin mediates inhibition of β-catenin/Tcf/Lef signaling and acts as a tumor suppressor (5, 33). Since inhibition of claudin-1 expression in SW620 cells resulted in a robust increase in E-cadherin expression, this prompted us to investigate whether or not the β-catenin/Tcf/Lef signaling pathway is also inhibited in SW620siRNA cells. To explore this possibility, we analyzed β-catenin/Tcf/Lef signaling in SW620control and SW620siRNA clones as well as SW480control and SW480claudin-1 cells using Tcf and mutant Tcf reporter plasmids (TOPflash and FOPflash, respectively) Tcf/Lef luciferase reporter constructs, a well-established assay for measuring transcriptional activation due to activated β-catenin signaling. Briefly, SW480claudin-1 and SW620siRNA cell lines and their respective control cells were transfected with plasmids encoding multimerized wild-type (TOP) or mutant (FOP) Lef binding sites followed by a luciferase reporter gene. To control for transfection efficiency, we cotransfected a SV40-driven β-galactosidase with reporter constructs. Relative luciferase activities were calculated as described in Methods. As shown in Figure 6D (upper panel), the relative transcriptional activity of the β-catenin/Lef complex was induced (2- to 4-fold) in SW480claudin-1 cells compared with SW480control cells, whereas it decreased (4- to 5-fold) in SW620siRNA cells compared with SW620control cells.
To further determine the effects of changes in β-catenin activity due to claudin-1 manipulations, we examined the levels of expression of c-Myc, a known target gene for Wnt/β-catenin signaling in SW480 and SW620 cell lines with genetically altered claudin-1 expression. Consistent with the Wnt/β-catenin/Tcf activities, c-Myc expression levels were increased with overexpression of claudin-1 in SW480claudin-1 cells and decreased with inhibition of claudin-1 in SW620siRNA cells (Figure 6D, lower panel).
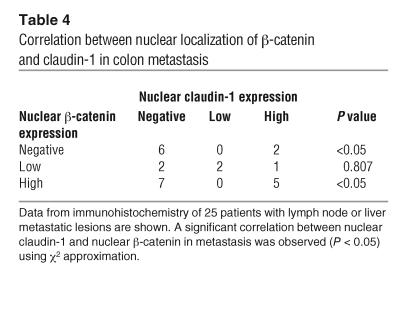
Based on these observations, we examined whether or not there is a correlation between nuclear localization of β-catenin and claudin-1. Immunohistochemical analysis of metastatic colon cancer tissue samples, from the same 25 patients previously examined for claudin-1 expression, was performed in order to detect β-catenin expression. As shown in Table 4, a significant correlation (P < 0.05) between nuclear localization of β-catenin and claudin-1 was observed, which suggests a role for claudin-1 in the regulation of β-catenin activity.
Table 4.
Correlation between nuclear localization of β-catenin and claudin-1 in colon metastasis
Discussion
This study was undertaken to understand the biological significance of altered claudin-1 expression in colon cancer. Our data demonstrated increased claudin-1 expression in human colon cancers, particularly in metastatic lesions, where it was frequently mislocalized from the cell membrane to the cell cytoplasm and nucleus. We also detected abundant nuclear and cytoplasmic claudin-1 in selected colon cancer cell lines. Mutation of the APC gene (thus β-catenin activation and nuclear translocation) is present in a majority of human colorectal carcinomas (34). Claudin-1 was recently identified as a probable target of β-catenin/Tcf transcriptional activation in SW480 cells (26). It is interesting that colon cancer cells that expressed claudin-1 (HT29, SW480, and SW620) all harbor mutations in APC and have activated β-catenin/Tcf signaling. Interestingly, RIE and HCT116 cells express wild-type APC (35), but neither cell line expresses detectable levels of claudin-1, despite the presence of a mutation in HCT116 cells that results in β-catenin stabilization. These results imply that there are other mechanisms underlying the silencing of claudin-1 in HCT116 cells and that β-catenin/Tcf activation alone is insufficient to activate expression of the claudin-1 gene. Our studies have not excluded the possibility that an intact APC protein could regulate the expression of claudin-1 independently of the β-catenin/Tcf pathway.
The observation of increased claudin-1 expression and subcellular localization to the cytoplasm and nucleus in neoplastic tissues is further supported by our findings in adenomas of ApcMin/+ mice. As mentioned before, Min adenomas are known to express mutant APC due to somatic inactivation of the second allele. Histologically normal intestinal epithelium of heterozygous ApcMin/+ mice expresses wild-type APC protein and expresses a normal pattern of claudin-1 protein that is predominantly localized on cell membrane, with a small portion in the cytoplasm. These observations support the conclusion that regulation of claudin-1 expression is an important role of APC; whether this occurs as a consequence of APC regulation of β-catenin/Tcf activation or by another, more direct mechanism remains to be determined.
An important finding of our study was the nuclear localization of claudin-1 in a significant subset of colon cancer samples, particularly among the subset of liver metastatic lesions. Nuclear localization of several cell junction proteins (β-catenin, ZO-1, ZO-2) is known to be correlated with oncogenic transformation and cell proliferation (36, 37). β-Catenin, a component of AJs, plays a well-characterized dual role in cell adhesion (membrane localized) and in signal transduction (cytoplasmic and nuclear) leading to epithelial cell transformation. Further, mutants of the TJ protein ZO-1 that no longer localize at the plasma membrane induce a dramatic epithelial-mesenchymal transition (EMT) of Madin-Darby canine kidney I cells (38). The nuclear localization of claudin-1 in our study was confirmed by several methods. First, 2 distinct antibodies to claudin-1 were used for immunofluorescence and immunohistochemistry studies, respectively, and yielded similar results. Additionally, the nuclear and cytoplasmic fractions clearly demonstrate the presence of claudin-1 in nuclear lysates from SW480 and SW620 cells. There was no difference in the molecular weight of claudin-1 protein recognized in nuclear or cytoplasmic fractions, which suggests that this nuclear localization does not involve major cleavage or modification of the protein. However, the question remains: How is this transmembrane protein translocated to the nucleus? Using a nuclear localization software–based analysis (Nuclear Localization Signal database; Columbia University Bioinformatics Center; http://cubic.bioc.columbia.edu/db/NLSdb) of the claudin-1 sequence, we did not detect any putative nuclear localization signal (NLS). Although NLS sequences are the predominant types of nuclear import elements, other sequences such as PDZ domains are known to be important for targeting proteins to the nucleus. One of the potential mechanisms by which claudin-1 could translocate to the nucleus is through binding to ZO-1 or ZO-2, in a manner similar to Armadillo-repeat gene deleted in Velo-cardio-facial syndrome (ARVCF), a member of p120 family. Interaction with ZO-2 via its PDZ binding motif results in ARVCF translocation to the nucleus (39). Other examples of proteins that translocate to the nucleus independently of NLS include tumor suppressors such as APC and BRCA1 (40–42). Yet another potential mechanism by which claudin-1 could translocate to the nucleus is by using chaperon or other accessory proteins such as importin-β (43, 44). Studies are currently underway in our laboratory to define the mechanism of claudin-1 translocation to the nucleus.
The importance of claudin-1 as a regulator of colon carcinogenesis is apparent from our studies involving in vitro genetic manipulation of claudin-1 in cultured cells and from the in vivo nude mice studies. As mentioned above, although SW480 and SW620 cells share a similar genetic background, SW620 cells form tumors faster than do SW480 cells, and they metastasize, while SW480 cells do not (28). These 2 cell lines have differential claudin-1 expression, with much higher levels in the metastasizing SW620 cells. The differential claudin-1 expression may be one of the reasons for functional differences in these cells. Indeed, modulation of claudin-1 in these cells induced complex morphological changes accompanied by changes in EMT markers and other EMT-related functional behaviors, including migration, anoikis, anchorage-independent growth, invasion, and MMP activation. Interestingly, while overexpression of claudin-1 increases activity of both MMP-2 and MMP-9, inhibition of claudin-1 induced a significant decrease only in MMP-9 activity. As mentioned in Results, siRNA-based inhibition of claudin-1 was 80–90%, and it is possible that the remaining claudin-1 was enough to maintain MMP-2 in its active form. Furthermore, SW480claudin-1 cells formed tumors at a significantly faster rate and caused multiple liver metastases compared with SW480control cells, which did not cause any liver metastases. In contrast, the xenograft tumor formation and metastatic ability of SW620siRNA cells was significantly decreased compared with that of SW620control cells in nude mice. However, it remains to be determined which individual or combinations of specific downstream consequences of high levels of claudin-1 are primarily responsible for the metastatic phenotype.
Our observations that E-cadherin transcription increased along with decreased expression of mesenchymal markers and characteristics after inhibition of claudin-1 expression are consistent with data showing that loss of E-cadherin consistently occurs at sites of EMT during development and in cancer. This loss contributes to tumor cell invasiveness in vitro and promotes transition of adenoma to carcinoma in animal models (45). E-cadherin is known to be regulated at the transcriptional level by the zinc finger transcription factors, Snail and Slug. Both of these transcription factors repress expression of E-cadherin (30–32). However, neither Snail nor Slug mRNA expression is altered in SW620siRNA cells. Recent studies have demonstrated that changes in protein phosphorylation and cellular localization of Snail protein are important for its activity (46–48). Currently, we are in the process of analyzing the details of differences in Snail protein expression and/or activity due to manipulation of claudin-1 protein expression.
Although overexpression of claudin-1 in SW480 cells induced a decrease in membrane-localized E-cadherin, there was a simultaneous increase in cytoplasmic E-cadherin that might explain unchanged steady-state levels of E-cadherin expression. Furthermore, SW480 cells express comparatively low levels of E-cadherin, and there is low endogenous expression of claudin-1 in these cells. Therefore, claudin-1–dependent transcriptional regulation of E-cadherin may already be at its threshold in these cells. Studies using other colon cancer cell lines with abundant E-cadherin expression and no claudin-1 expression are currently underway in our laboratory to define this interesting observation. While E-cadherin expression increased, β-catenin/Tcf/Lef signaling was significantly inhibited in SW620siRNA cells. β-Catenin/Tcf/Lef has been implicated in signaling events leading to EMT in vivo during embryonic development and in vitro in epithelial cells (49). We observed an inverse correlation between β-catenin/Tcf/Lef transcriptional activity and the expression of E-cadherin in the SW620siRNA cells. Our observations are consistent with previous studies using SW480 colon cancer cells, in which the tumor suppressor activity of E-cadherin was shown to be due to inhibition of the β-catenin/Tcf signaling pathway, and suggest that loss of E-cadherin expression results in upregulation of β-catenin/Tcf signaling pathway in human cancers (50). Taken together, these data suggest that both the modulation of β-catenin/Tcf signaling and E-cadherin expression and localization play important roles in the claudin-1–dependent regulation of EMT. Other mechanisms relevant to claudin-1 overexpression in colon cancer are still under investigation. However, the present observations raise the possibility of exploiting claudin-1 as a potential biomarker for colon cancer progression and might provide new opportunities for therapeutic intervention.
Methods
Plasmids and reagents.
The antibodies against claudin-1, -4, and -7 were obtained from Zymed Laboratories Inc. Actin and vimentin antibodies were purchased from Sigma-Aldrich. Anti–β-catenin and –E-cadherin antibodies were purchased from BD Biosciences – Transduction Laboratories. Anti–c-Myc antibody was purchased from Santa Cruz Biotechnology Inc. Luciferase reporter constructs containing E-cadherin 5′ flanking sequence were generously provided by Eric Fearon (University of Michigan, Ann Arbor, Michigan, USA) (Ecad3 [1,484 bp] and Ecad5 [493 bp]) (51). The siRNA cassettes were synthesized by GenScript Corp. and contained siRNA oligonucleotide against human claudin-1 (CATCTTCATCAATATGGAA) downstream of U6 promoter with custom restriction sites (BamHI and MluI), which were used for subcloning into pRNA-neo for stable transfections. A control siRNA oligonucleotide, which does not match any known human coding cDNA, was used as control. The Lef/Tcf reporter plasmid, TOPflash, and its mutant control, FOPflash, were purchased from Upstate.
Cell culture and transfection.
The human colon cancer cell lines HCT116, HT29, SW480, and SW620 and normal RIE cells were obtained from ATCC and cultured in DMEM containing 10% FBS. One day before transfection, the cells were seeded in 6-well cell culture plates to provide a final density of 60–70% confluence. Cells were transfected (52) using Effectene Transfection Reagent (QIAGEN) as described previously. We calculated fold stimulation for each sample by dividing the normalized luciferase activity by the value obtained from the control transfection containing empty parental expression vectors (pCMVs). The stable clones were generated using neomycin as selection reagent.
Immunoblot analysis.
Immunoblotting was done according to our standard protocol, as described previously (53). The signal was visualized with HRP-conjugated secondary antibodies using enhanced chemiluminescence (Pierce).
Immunohistochemistry and immunofluorescence.
Paraffin-embedded tumors and normal tissue samples were obtained from colon cancer patients with primary and metastatic disease using protocols approved by the Vanderbilt University Institutional Review Board. Each primary colon cancer specimen was matched with either simultaneous lymph node or liver metastasis from the same patient. Immunohistochemistry was performed using rabbit anti–claudin-1 antibody as described previously (52). Immunofluorescence was performed using the following primary antibodies: rabbit anti–claudin-1 and –claudin-7, mouse anti–E-cadherin and –β-catenin, and anti-vimentin. Secondary antibodies were either donkey anti-rabbit Rhodamine Red-X or goat anti-mouse FITC (Jackson Immunoresearch Laboratories Inc.). Stained sections were viewed and photographed using a fluorescence microscope.
Nuclear/cytoplasmic/membrane extracts.
Confluent colon cancer cells were used for isolation of nuclei and cytoplasmic and membrane fractions as described previously (52). All samples were stored frozen at –80°C until analysis. To ensure no cross-contamination between the fractions, the same membrane was stripped and reprobed with antibodies to α-tubulin (a cytosol-specific protein) or hnRNP70 (a nucleus-specific protein).
RNA isolation and RT-PCR.
Total RNA was extracted from colon cancer cells with a QIAGEN RNeasy kit. Full-length claudin-1 cDNA was amplified using primers based on the published human claudin-1 sequence (GenBank accession number AH010563), and was sucloned into pCMV-Script Vector (Stratagene) for stable transfections. For semiquantitative RT-PCR analyses, random-primed, first-strand cDNA was generated from 1 μg total RNA (RETROscript Kit; Ambion) per the manufacturer’s recommendation. PCR analysis was performed using gene-specific primers and diluted first-strand cDNA as template. PCR cycles were limited to 25, and primers for actin were used as internal control.
Anchorage-independent growth.
A total of 40,000 cells was plated in 1 ml of DMEM with 0.3% low-melting agarose and 10% FBS and overlaid onto 1 ml/35 mm dish of DMEM with 0.5% agarose and 10% FBS. After 2 weeks, plates were photographed (×40) and colonies were counted by using the Bio-Rad Gel Doc colony-counting function. The results represent the mean of 3 individual experiments.
Gelatin zymography.
Cells were plated at a density of 200,000 in 24-well plates. After 16 hours, cells were washed with PBS and incubated in 300 ml of serum-free medium for 24 hours. Fifty-milliliter aliquots of conditioned medium were diluted in sample buffer (5% SDS), 20% glycerol in 0.4 mol/l Tris, pH 6.8 containing 0.02% bromophenol blue without 2-mercaptoethanol and were loaded for zymography on a 10% polyacrylamide gel containing 1 mg/ml gelatin. Afterwards, gels were washed for 30 minutes in 2.5% Triton X-100 and incubated for 24 hours at 37°C in 50 mM Tris, pH 7.5, 10 mM CaCl2, 0.02% NaAzide. The buffer was decanted and the gels stained with 0.5% Coomassie blue G in 30% methanol and 10% acetic acid for 10 minutes at room temperature on a rotary shaker. Stain was washed out with water until clear bands were seen. Areas where proteolytic activity degraded the gelatin were identified as demonstrating an absence of staining.
MTT assay.
Cells were seeded at 5 × 10³ cells/well in 96-well plates and cultured in 100 μl of DMEM/F12/0.2% FBS. Triplicate culture wells were set up for each treatment. The CellTiter 96 assay from Promega was used to perform MTT assay as recommended by the manufacturer. Briefly, at days 1, 3, 5, and 7, 15 μl MTT dye solution from was added to each well, and samples were incubated at 37°C for 4 hours. After 4 hours, 100 μl of the stop solution was added to each well, and samples were incubated further for 1 hour. The absorbance was then read at OD at 570 nm using 96-well plate reader. Growth curve was plotted for a period of 7 days.
Anoikis-induced apoptosis.
Anoikis was induced by plating cells on polyHEMA-coated culture plates. Seventy-two hours after plating, cells were collected by gentle pipetting and were either replated on regular culture dishes for 24 hours or were centrifuged to pellet down for apoptosis assay. The cells plated on regular culture dishes were photographed after 24 hours of plating and then trypsinized for manual counting. The apoptosis assay was performed on the cell pellet using the Cell Death Detection ELISAPLUS kit from Roche Diagnostics Corp. as described by the manufacturer. Briefly, the cells were lysed using lysis buffer provided in the kit, the nuclei pellet was removed by centrifugation, and the supernatant (cell lysate) was used to determine the amount of apoptotic nucleosomes present. The absorbance was measured at 405 nm.
Cell migration and cell culture wound assay.
Wounds were created in confluent cells using a pipette tip. The cells were then rinsed with medium to remove any free-floating cells and debris. Serum-free medium was then added, and culture plates were incubated at 37°C. Wound healing was observed at 0, 24, 48, and 72 hours within the scrape line, and representative scrape lines for each cell line were photographed. Duplicate wells of each condition were examined for each experiment, and each experiment was repeated 3 times.
Invasion assay.
Transwell filters (8.0 μm) were coated overnight with 100 μg/ml collagen type I (Sigma-Aldrich). Cells were suspended at 100,000 cells per well in 12-well filter plates (Falcon; BD) in serum-free medium. Serum containing medium (0.5%) was utilized as the chemoattractant in the lower chamber. After 72 hours of incubation, cells that had invaded to the lower surface of the collagen-coated membrane were fixed with 70% ethanol, stained with crystal blue, and counted in 5 randomly selected fields under a light microscope. Data are expressed as mean ± SD of 3 individual experiments.
In vivo studies.
All animal experiments were conducted with the approval of the Institutional Animal Care and Use Committee (IACUC) of Vanderbilt University. Tumorigenicity was assessed by subcutaneous flank inoculation of 1 × 10⁶ cells in 6-week-old female athymic nude mice, and animals were assessed 4 weeks after inoculation. Five mice were used for each clone.
To asses the impact of overexpression or inhibition of claudin-1 on metastasis in vivo, female athymic/nude mice (7 weeks old; n = 5) were injected in the spleen with 5 × 10⁶ cells of either SW480control and SW480claudin-1 cells or SW620 parental, SW620control, and SW620siRNA cells. The spleen was removed after tumor cell injection, and a small hemoclip was applied to the splenic vessels. Nude mice in the SW480 group were sacrificed at 4 weeks, and the number and size of metastatic tumor foci on the surface of the livers were documented. For the SW620 group, small-animal microPET imaging was used to screen for nonpalpable lesions in the liver, using 100–150 μCi of 18F-deoxyglucose (18FDG) injected i.p to detect metabolically active foci in the abdomen. When the tumors were visible by microPET (7 weeks), the mice were subjected to autopsy. The number and size of metastatic tumor foci on the surface of the livers were documented.
Statistical analysis.
A Student’s t test and 2-sided test of proportions were used to determine statistical significance, and differences were considered statistically significant at P ≤ 0.05. The test for linear association between claudin-1 staining and tumor progression was performed using a contingency table approach with χ2 approximation.
Supplementary Material
Acknowledgments
This work was supported by NIH grants DK52334 and CA69457 (to R.D. Beauchamp), the Vanderbilt-Ingram Cancer Center Support grant (P30 CA68485), and National Cancer Institute Specialized Programs of Research Excellence Grants in Gastrointestinal Cancer P50 CA95103 and 5P50 CA095103 (to P. Dhawan).
Footnotes
Nonstandard abbreviations used: AJ, adherens junction; APC, adenomatous polyposis coli; EMT, epithelial-mesenchymal transition; FSP1, fibroblast-specific protein–1; MTT, tetrazolium salt; NLS, nuclear localization signal; RIE cell, rat intestinal epithelial cell; siRNA, small interfering RNA; TJ, tight junction; ZO-1, zona occludens 1.
Conflict of interest: The authors have declared that no conflict of interest exists.
References
- 1.Marques FR, Fonsechi-Carvasan GA, De Angelo Andrade LAL, Bottcher-Luiz F. Immunohistochemical patterns for alpha- and beta-catenin, E- and N-cadherin expression in ovarian epithelial tumors. Gynecol. Oncol. 2004;94:16–24. doi: 10.1016/j.ygyno.2004.03.037. [DOI] [PubMed] [Google Scholar]
- 2.Nelson WJ, Nusse R. Convergence of Wnt, beta-catenin, and cadherin pathways. Science. 2004;303:1483–1487. doi: 10.1126/science.1094291. [DOI] [PMC free article] [PubMed] [Google Scholar]
- 3.Al-Aynati MM, Radulovich N, Riddell RH, Tsao M-S. Epithelial-cadherin and beta-catenin expression changes in pancreatic intraepithelial neoplasia. Clin. Cancer Res. 2004;10:1235–1240. doi: 10.1158/1078-0432.ccr-03-0087. [DOI] [PubMed] [Google Scholar]
- 4.Conacci-Sorrell M, et al. Autoregulation of E-cadherin expression by cadherin-cadherin interactions: the roles of beta-catenin signaling, Slug, and MAPK. J. Cell Biol. 2003;163:847–857. doi: 10.1083/jcb.200308162. [DOI] [PMC free article] [PubMed] [Google Scholar]
- 5.Moon RT, Bowerman B, Boutros M, Perrimon N. The promise and perils of Wnt signaling through beta-catenin [review] Science. 2002;296:1644–1646. doi: 10.1126/science.1071549. [DOI] [PubMed] [Google Scholar]
- 6.Kolligs FT, Bommer G, Göke B. Wnt/beta-catenin/tcf signaling: a critical pathway in gastrointestinal tumorigenesis [review] Digestion. 2002;66:131–144. doi: 10.1159/000066755. [DOI] [PubMed] [Google Scholar]
- 7.Wong NACS, Pignatelli M. Beta-catenin — a linchpin in colorectal carcinogenesis? [review] Am. J. Pathol. 2002;160:389–401. doi: 10.1016/s0002-9440(10)64856-0. [DOI] [PMC free article] [PubMed] [Google Scholar]
- 8.Clevers H. Wnt breakers in colon cancer [review] Cancer Cell. 2004;5:5–6. doi: 10.1016/s1535-6108(03)00339-8. [DOI] [PubMed] [Google Scholar]
- 9.Wheelock MJ, Johnson KR. Cadherins as modulators of cellular phenotype. Ann. Rev. Cell Dev. Biol. 2003;19:207–235. doi: 10.1146/annurev.cellbio.19.011102.111135. [DOI] [PubMed] [Google Scholar]
- 10.Tsukita S, Furuse M. Claudin-based barrier in simple and stratified cellular sheets. Curr. Opin. Cell Biol. 2002;14:531–536. doi: 10.1016/s0955-0674(02)00362-9. [DOI] [PubMed] [Google Scholar]
- 11.Tsukita S, Furuse M, Itoh M. Multifunctional strands in tight junctions. Nat. Rev. Mol. Cell Biol. 2001;2:285–293. doi: 10.1038/35067088. [DOI] [PubMed] [Google Scholar]
- 12.McCarthy K, et al. Occludin is a functional component of the tight junction. J. Cell Sci. 1996;109:2287–2298. doi: 10.1242/jcs.109.9.2287. [DOI] [PubMed] [Google Scholar]
- 13.Lui WY, Lee WM, Cheng CY. Transforming growth factor-beta3 perturbs the inter-Sertoli tight junction permeability barrier in vitro possibly mediated via its effects on occludin, zonula occludens-1, and claudin-11. Endocrinology. 2001;142:1865–1877. doi: 10.1210/endo.142.5.8116. [DOI] [PubMed] [Google Scholar]
- 14.Morita K, Furuse M, Fujimoto K, Tsukita S. Claudin multigene family encoding four-transmembrane domain protein components of tight junction strands. Proc. Natl. Acad. Sci. U. S. A. 1999;96:511–516. doi: 10.1073/pnas.96.2.511. [DOI] [PMC free article] [PubMed] [Google Scholar]
- 15.Kaihara T, et al. Dedifferentiation and decreased expression of adhesion molecules, E-cadherin and ZO-1, in colorectal cancer are closely related to liver metastasis. J. Exp. Clin. Cancer Res. 2003;22:117–123. [PubMed] [Google Scholar]
- 16.Tobioka H, et al. Occludin expression decreases with the progression of human endometrial carcinoma. Hum. Pathol. 2004;35:159–164. doi: 10.1016/j.humpath.2003.09.013. [DOI] [PubMed] [Google Scholar]
- 17.Kominsky SL, et al. Loss of the tight junction protein claudin-7 correlates with histological grade in both ductal carcinoma in situ and invasive ductal carcinoma of the breast. Oncogene. 2003;22:2021–2033. doi: 10.1038/sj.onc.1206199. [DOI] [PubMed] [Google Scholar]
- 18.Michl P, et al. Claudin-4 expression decreases invasiveness and metastatic potential of pancreatic cancer. Cancer Res. 2003;63:6265–6271. [PubMed] [Google Scholar]
- 19.Rangel LB, et al. Tight junction proteins claudin-3 and claudin-4 are frequently overexpressed in ovarian cancer but not in ovarian cystadenomas. Clin. Cancer Res. 2003;9:2567–2575. [PubMed] [Google Scholar]
- 20.Itoh M, et al. Direct binding of three tight junction-associated MAGUKs, ZO-1, ZO-2, and ZO-3, with the COOH termini of claudins. J. Cell Biol. 1999;147:1351–1363. doi: 10.1083/jcb.147.6.1351. [DOI] [PMC free article] [PubMed] [Google Scholar]
- 21.Hamazaki Y, Itoh M, Sasaki H, Furuse M, Tsukita S. Multi-PDZ domain protein 1 (MUPP1) is concentrated at tight junctions through its possible interaction with claudin-1 and junctional adhesion molecule. J. Biol. Chem. 2002;277:455–461. doi: 10.1074/jbc.M109005200. [DOI] [PubMed] [Google Scholar]
- 22.Grande M, et al. Transforming growth factor-{beta} and epidermal growth factor synergistically stimulate epithelial to mesenchymal transition (EMT) through a MEK-dependent mechanism in primary cultured pig thyrocytes. J. Cell Sci. 2002;115:4227–4236. doi: 10.1242/jcs.00091. [DOI] [PubMed] [Google Scholar]
- 23.Singh AB, Harris RC. Epidermal growth factor receptor activation differentially regulates claudin expression and enhances transepithelial resistance in Madin-Darby canine kidney cells. J. Biol. Chem. 2004;279:3543–3552. doi: 10.1074/jbc.M308682200. [DOI] [PubMed] [Google Scholar]
- 24.Ichiyasu H, et al. Matrix metalloproteinase-9-deficient dendritic cells have impaired migration through tracheal epithelial tight junctions. Am. J. Respir. Cell Mol. Biol. 2004;30:761–770. doi: 10.1165/rcmb.2003-0370OC. [DOI] [PubMed] [Google Scholar]
- 25.Miyamori H, et al. Claudin promotes activation of pro-matrix metalloproteinase-2 mediated by membrane-type matrix metalloproteinases. J. Biol. Chem. 2001;276:28204–28211. doi: 10.1074/jbc.M103083200. [DOI] [PubMed] [Google Scholar]
- 26.Miwa N, et al. Involvement of claudin-1 in the beta-catenin/Tcf signaling pathway and its frequent upregulation in human colorectal cancers. Oncol. Res. 2000;12:469–476. doi: 10.3727/096504001108747477. [DOI] [PubMed] [Google Scholar]
- 27.Shoemaker AR, Gould KA, Luongo C, Moser AR, Dove WF. Studies of neoplasia in the Min mouse. . Biochim. Biophys. Acta. 1997; 1332:F25–F48. doi: 10.1016/s0304-419x(96)00041-8. [DOI] [PubMed] [Google Scholar]
- 28.Hewitt RE, et al. Validation of a model of colon cancer progression. J. Pathol. 2000;192:446–454. doi: 10.1002/1096-9896(2000)9999:9999<::AID-PATH775>3.0.CO;2-K. [DOI] [PubMed] [Google Scholar]
- 29.Xue C, Plieth D, Venkov C, Xu C, Neilson EG. The gatekeeper effect of epithelial-mesenchymal transition regulates the frequency of breast cancer metastasis. Cancer Res. 2003;63:3386–3394. [PubMed] [Google Scholar]
- 30.Hajra KM, Chen DY-S, Fearon ER. The SLUG zinc-finger protein represses E-cadherin in breast cancer. Cancer Res. 2002;62:1613–1618. [PubMed] [Google Scholar]
- 31.Batlle E, et al. The transcription factor snail is a repressor of E-cadherin gene expression in epithelial tumour cells. Nat. Cell Biol. 2000;2:84–89. doi: 10.1038/35000034. [DOI] [PubMed] [Google Scholar]
- 32.Cano A, et al. The transcription factor snail controls epithelial-mesenchymal transitions by repressing E-cadherin expression. Nat. Cell Biol. 2000;2:76–83. doi: 10.1038/35000025. [DOI] [PubMed] [Google Scholar]
- 33.Gottardi CJ, Gumbiner BM. Adhesion signaling: how [beta]-catenin interacts with its partners. Curr. Biol. 2001;11:R792–R794. doi: 10.1016/s0960-9822(01)00473-0. [DOI] [PubMed] [Google Scholar]
- 34.Kinzler KW, Vogelstein B. Lessons from hereditary colorectal cancer. Cell. 1996;87:159–170. doi: 10.1016/s0092-8674(00)81333-1. [DOI] [PubMed] [Google Scholar]
- 35.Flohr T, et al. Detection of mutations in the DNA polymerase delta gene of human sporadic colorectal cancers and colon cancer cell lines. Int. J. Cancer. 1999;80:919–929. doi: 10.1002/(sici)1097-0215(19990315)80:6<919::aid-ijc19>3.0.co;2-u. [DOI] [PubMed] [Google Scholar]
- 36.Islas S, Vega J, Ponce L, Gonzalez-Mariscal L. Nuclear localization of the tight junction protein ZO-2 in epithelial cells. Exp. Cell Res. 2002;274:138–148. doi: 10.1006/excr.2001.5457. [DOI] [PubMed] [Google Scholar]
- 37.Gottardi CJ, Arpin M, Fanning AS, Louvard D. The junction-associated protein, zonula occludens-1, localizes to the nucleus before the maturation and during the remodeling of cell-cell contacts. Proc. Natl. Acad. Sci. U. S. A. 1996;93:10779–10784. doi: 10.1073/pnas.93.20.10779. [DOI] [PMC free article] [PubMed] [Google Scholar]
- 38.Reichert M, Muller T, Hunziker W. The PDZ domains of zonula occludens-1 induce an epithelial to mesenchymal transition of Madin-Darby canine kidney I cells. Evidence for a role of beta-catenin/Tcf/Lef signaling. J. Biol. Chem. 2000;275:9492–9500. doi: 10.1074/jbc.275.13.9492. [DOI] [PubMed] [Google Scholar]
- 39.Kausalya PJ, Phua DCY, Hunziker W. Association of ARVCF with zona occludens (ZO)-1 and ZO-2: binding to PDZ-domain proteins and cell-cell adhesion regulate plasma membrane and nuclear localization of ARVCF. Mol. Biol. Cell. 2004;15:5503–5515. doi: 10.1091/mbc.E04-04-0350. [DOI] [PMC free article] [PubMed] [Google Scholar]
- 40.Fagotto F, Gluck U, Gumbiner BM. Nuclear localization signal-independent and importin/karyopherin-independent nuclear import of [beta]-catenin. Curr. Biol. 1998;8:181–190. doi: 10.1016/s0960-9822(98)70082-x. [DOI] [PubMed] [Google Scholar]
- 41.Fabbro M, Rodriguez JA, Baer R, Henderson BR. BARD1 induces BRCA1 intranuclear foci formation by increasing RING-dependent BRCA1 nuclear import and inhibiting BRCA1 nuclear export. J. Biol. Chem. 2002;277:21315–21324. doi: 10.1074/jbc.M200769200. [DOI] [PubMed] [Google Scholar]
- 42.Wu LC, et al. Identification of a RING protein that can interact in vivo with the BRCA1 gene product. Nat. Genet. 1996;14:430–440. doi: 10.1038/ng1296-430. [DOI] [PubMed] [Google Scholar]
- 43.Reilly JF, Maher PA. Importin {beta}-mediated nuclear import of fibroblast growth factor receptor: role in cell proliferation. J. Cell Biol. 2001;152:1307–1312. doi: 10.1083/jcb.152.6.1307. [DOI] [PMC free article] [PubMed] [Google Scholar]
- 44.Lin S-Y, et al. Nuclear localization of EGF receptor and its potential new role as a transcription factor. Nat. Cell Biol. 2001;3:802–808. doi: 10.1038/ncb0901-802. [DOI] [PubMed] [Google Scholar]
- 45.Thiery JP. Epithelial-mesenchymal transitions in tumour progression. Nat. Rev. Cancer. 2002;2:442–454. doi: 10.1038/nrc822. [DOI] [PubMed] [Google Scholar]
- 46.Dominguez D, et al. Phosphorylation regulates the subcellular location and activity of the snail transcriptional repressor. Mol. Cell. Biol. 2003;23:5078–5089. doi: 10.1128/MCB.23.14.5078-5089.2003. [DOI] [PMC free article] [PubMed] [Google Scholar]
- 47.Zhou BP, et al. Dual regulation of snail by GSK-3beta-mediated phosphorylation in control of epithelial-mesenchymal transition. Nat. Cell Biol. 2004;6:931–940. doi: 10.1038/ncb1173. [DOI] [PubMed] [Google Scholar]
- 48.Yook JI, Li XY, Ota I, Fearon ER, Weiss SJ. Wnt-dependent regulation of the E-cadherin repressor snail. J. Biol. Chem. 2005;280:11740–11748. doi: 10.1074/jbc.M413878200. [DOI] [PubMed] [Google Scholar]
- 49.Kim K, Lu Z, Hay ED. Direct evidence for a role of [beta]-catenin/LEF-1 signaling pathway in induction of EMT. Cell Biol. Int. 2002;26:463–476. doi: 10.1006/cbir.2002.0901. [DOI] [PubMed] [Google Scholar]
- 50.Liebner S, et al. {beta}-Catenin is required for endothelial-mesenchymal transformation during heart cushion development in the mouse. J. Cell Biol. 2004;166:359–367. doi: 10.1083/jcb.200403050. [DOI] [PMC free article] [PubMed] [Google Scholar]
- 51.Ji X, Woodard AS, Rimm DL, Fearon ER. Transcriptional defects underlie loss of E-cadherin expression in breast cancer. Cell Growth Differ. 1997;8:773–778. [PubMed] [Google Scholar]
- 52.Dhawan P, Richmond A. A novel NF-kappa B-inducing kinase-MAPK signaling pathway up-regulates NF-kappa B activity in melanoma cells. J. Biol. Chem. 2002;277:7920–7928. doi: 10.1074/jbc.M112210200. [DOI] [PMC free article] [PubMed] [Google Scholar]
- 53.Dhawan P, Singh AB, Ellis DL, Richmond A. Constitutive activation of Akt/protein kinase B in melanoma leads to up-regulation of nuclear factor-kappaB and tumor progression. Cancer Res. 2002;62:7335–7342. [PubMed] [Google Scholar]
Associated Data
This section collects any data citations, data availability statements, or supplementary materials included in this article.


