Figure 6.
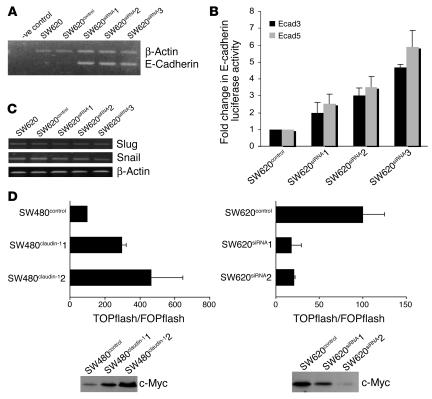
Effect of inhibition of claudin-1 on E-cadherin expression and β-catenin/Tcf/Lef activity. (A) Endogenous levels of E-cadherin mRNA were measured by semiquantitative RT-PCR using total RNA from SW620 parental or SW620control cells or 3 individual clones of SW620siRNA cells as described in Methods. Primers for actin were used as internal control in the same reaction. -ve control, without reverse transcriptase. (B) The luciferase reporter activity under the control of human E-cadherin promoter construct was measured in the SW620control and SW620siRNA cells. Each bar represents the mean ± SD of 3 experiments. (C) The endogenous levels of Snail and Slug mRNA measured by semiquantitative RT-PCR using RNA from SW620 parental, SW620control, and SW620siRNA cells. Primers for actin were used as a control. (D) SW480control and SW480claudin-1 or SW620control and SW620siRNA cells were transiently cotransfected with TOPflash or FOPflash reporter constructs and SV40–β-galactosidase as internal control (upper panel). Tcf-mediated gene transcription was determined by the ratio of pTOPflash to pFOPflash luciferase activity. Transfections were done in triplicate, and each bar represents the mean ± SD of 3 experiments. Immunoblot analysis of c-Myc in SW480claudin-1 and SW620siRNA cells compared with their respective control cells (lower panel).

