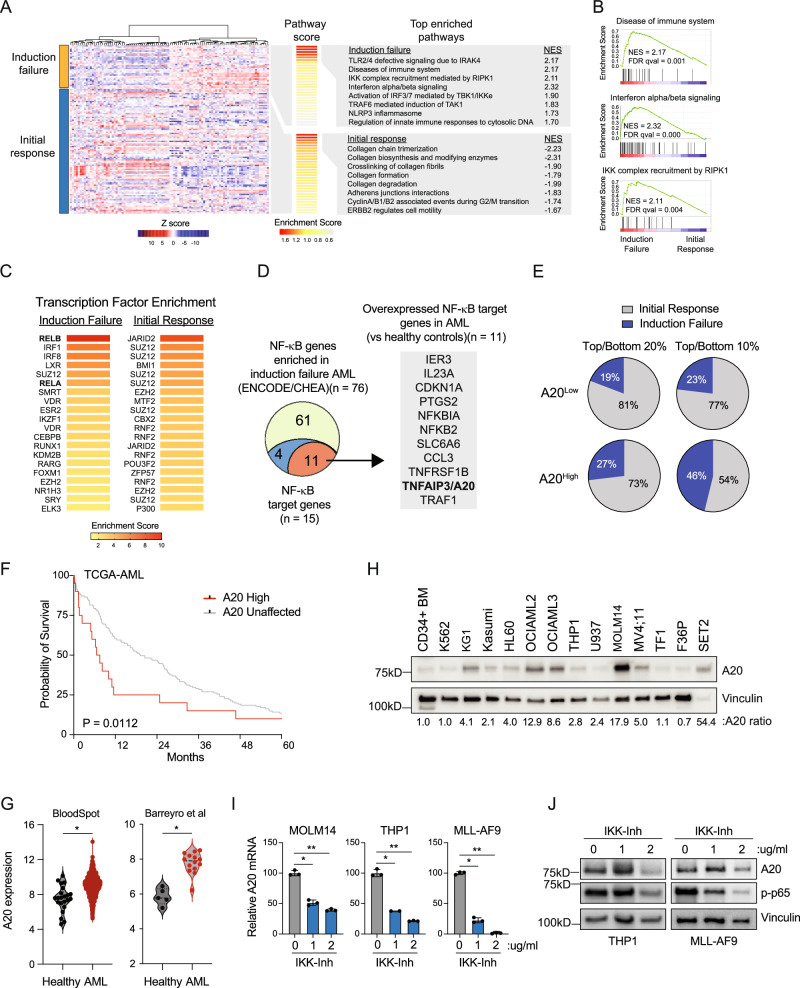
Fig. 1. The NF-κB target gene TNFAIP3/A20 is associated with induction failure in AML.
A Differentially expressed genes in TCGA AML patients with chemotherapy induction failure (n = 35) or initial response (n = 92) and top enriched pathways from REACTOME. Normalized enrichment score (NES). B GSEA plots comparing TCGA AML patients with induction failure or initial response in select immune-related enriched pathways. Normalized enrichment score (NES), false discovery rate (FDR). C Transcription factor enrichment analysis was based on the top and bottom differentially expressed genes from (A)(cut-offs ≥0.025 and <−0.025). D NF-κB genes from ENCODE/ChEA that are enriched in induction failure AML (n = 76), including NF-κB target genes (blue/red, n = 15), and NF-κB target genes that are overexpressed in AML compared to healthy controls (red, n = 11). E Proportion of TCGA AML patients with low expression of A20 (bottom 20% n = 26; bottom 10% n = 13) or high expression of A20 (bottom 20% n = 26; bottom 10% n = 13) that experienced induction failure or had an initial response to 7 + 3 chemotherapy. F Kaplan–Meier survival analysis of TCGA AML patients with high TNFAIP3/A20 expression (Z-score >2.0) versus all other AML patients (A20 unaffected). Gehan-Breslow-Wilcoxon test was used to determine significance. G A20 expression in AML patient blasts (n = 1730) versus healthy BM cells (n = 22)(BloodSpot56), or in AML GMPs (n = 5) versus healthy control GMPs (n = 14)(GSE35008 and GSE35010). Student’s t test (unpaired, two-tailed) was used to determine significance. H Immunoblot of healthy human cells and human AML cell lines (n = 3 independent experiments). I Quantitative PCR (qPCR) analysis of A20 mRNA expression in human AML cell lines (MOLM14, THP1), and mouse AML cells (MLL-AF9) cultured with IL-1B and treated IKK VII of for 20 min (n = 2–3 technical replicates in 3 independent experiments). Student’s t test (unpaired, two-tailed) was used to determine significance. J Immunoblot of A20 protein abundance in human AML cell lines (MOLM14, THP1), and mouse AML cells (MLL-AF9) cultured with IL-1β and treated with IKK VII for 20 min (n = 2 independent immunoblots). Error bars represent the standard error of the mean. *P < 0.05; **P < 0.01. Source data are provided as a source data file.

