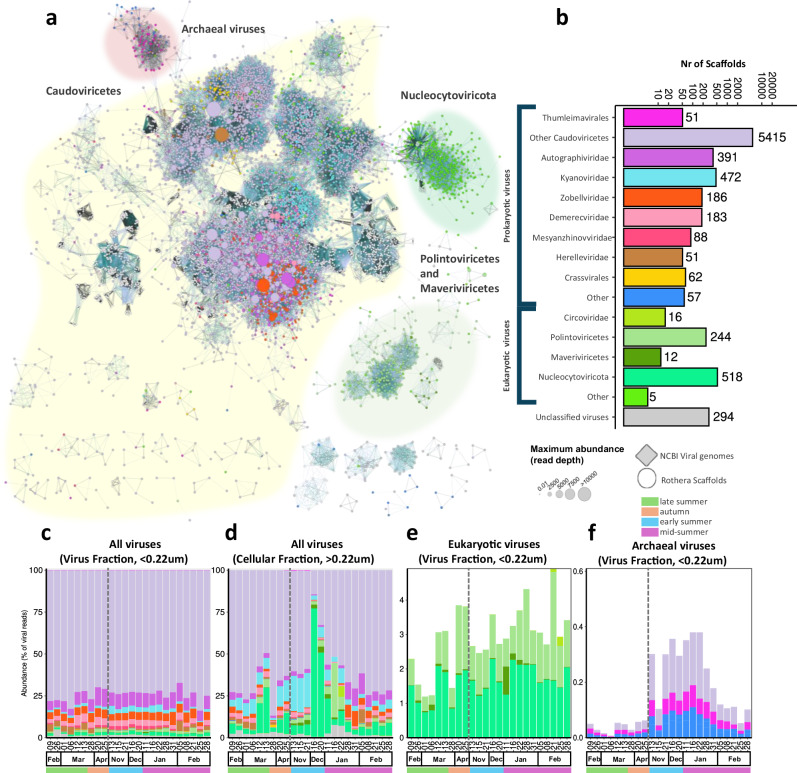
Fig. 1. Taxonomic diversity of Antarctic dsDNA viruses over the productive season.
a Gene sharing network of mid to high-quality viral contigs (>10 kb or 70% complete) coloured by taxonomic classification (see panel b for legend). The node size represents the maximum read abundance over the whole virome dataset. The shaded cluster was determined manually by overlaying the cenote-taker2 taxonomy. Family level taxonomy for Caudoviricetes predicted using PhaGCN2. Nucleocytoviricota, Maveriviricetes, Polintonviricetes, and Crassvirales were classified with a costume approach. b Number of scaffolds classified to each taxonomic rank (other represents ranks with less than 50 scaffolds). c–f Read abundance for viral taxa, reads were mapped to all scaffolds and abundance normalized to the total viral reads for all viruses in the viral fraction(<0.22 µm) (c) and cellular fraction (>0.22 µm) (d) and for archaeal viruses (f) and eukaryotic viruses (e) in the viral fraction (< 0.22 µm). Note that the are compositional and the total virus particle abundances (Fig. 3c). The dashed vertical line indicates the winter sampling gap between April and November 2018.

