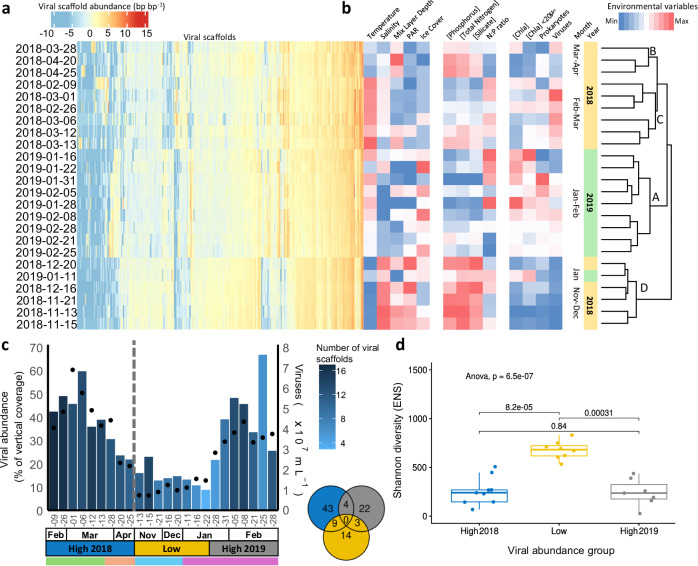
Fig. 2. Seasonal dynamics of viral diversity.
a Heatmap per sampling day of the clr-transformed scaffold vertical coverage (read abundance normalised by scaffold length) for mid to high quality scaffolds (> 10 kb or 70% complete). b changes of relevant environmental variables, including temperature, salinity, mix layer depth, photosynthetic active radiation (PAR), ice cover for physical variables, phosphorus, total nitrogen, silicate, and nitrogen to phosphorus ratio (N:P ratio) for chemical variables, and total Chlorophyll a (Chl-a), < 20 µm Chlorophyll a, prokaryotic cell counts, and viral particle counts for biological variables. The heatmap (a, b) are sorted vertically according to the hierarchical clustering of the clr-transformed viral abundances (dendrogram on the right). The letters on the dendrogram highlight the separate clusters referred to in the main text. c Compositional cumulative viral vertical coverage of dominant viral scaffolds (with abundance > 0.1%) for mid to high quality scaffolds. Bar colours represent the number of dominant viral scaffolds per day and black dots represent the flow cytometry viral particle counts for the same day. The Venn diagram shows the number of shared and unique dominant viral scaffolds between different periods. The grey line indicates the winter sampling gap between April and November 2018. d Shannon diversity expressed in effective number of species (ENS) for the samples (n = 24) in the high and low viral-scaffold abundance periods (box plot represent median ± quartiles and the whiskers the point range), these periods are denoted on (c), p-values for an ANOVA and pair-wise two-sided Wilcoxon tests are shown.

